Afghan vs Taiwanese Per Capita Income
COMPARE
Afghan
Taiwanese
Per Capita Income
Per Capita Income Comparison
Afghans
Taiwanese
$46,268
PER CAPITA INCOME
94.9/ 100
METRIC RATING
114th/ 347
METRIC RANK
$46,455
PER CAPITA INCOME
95.8/ 100
METRIC RATING
111th/ 347
METRIC RANK
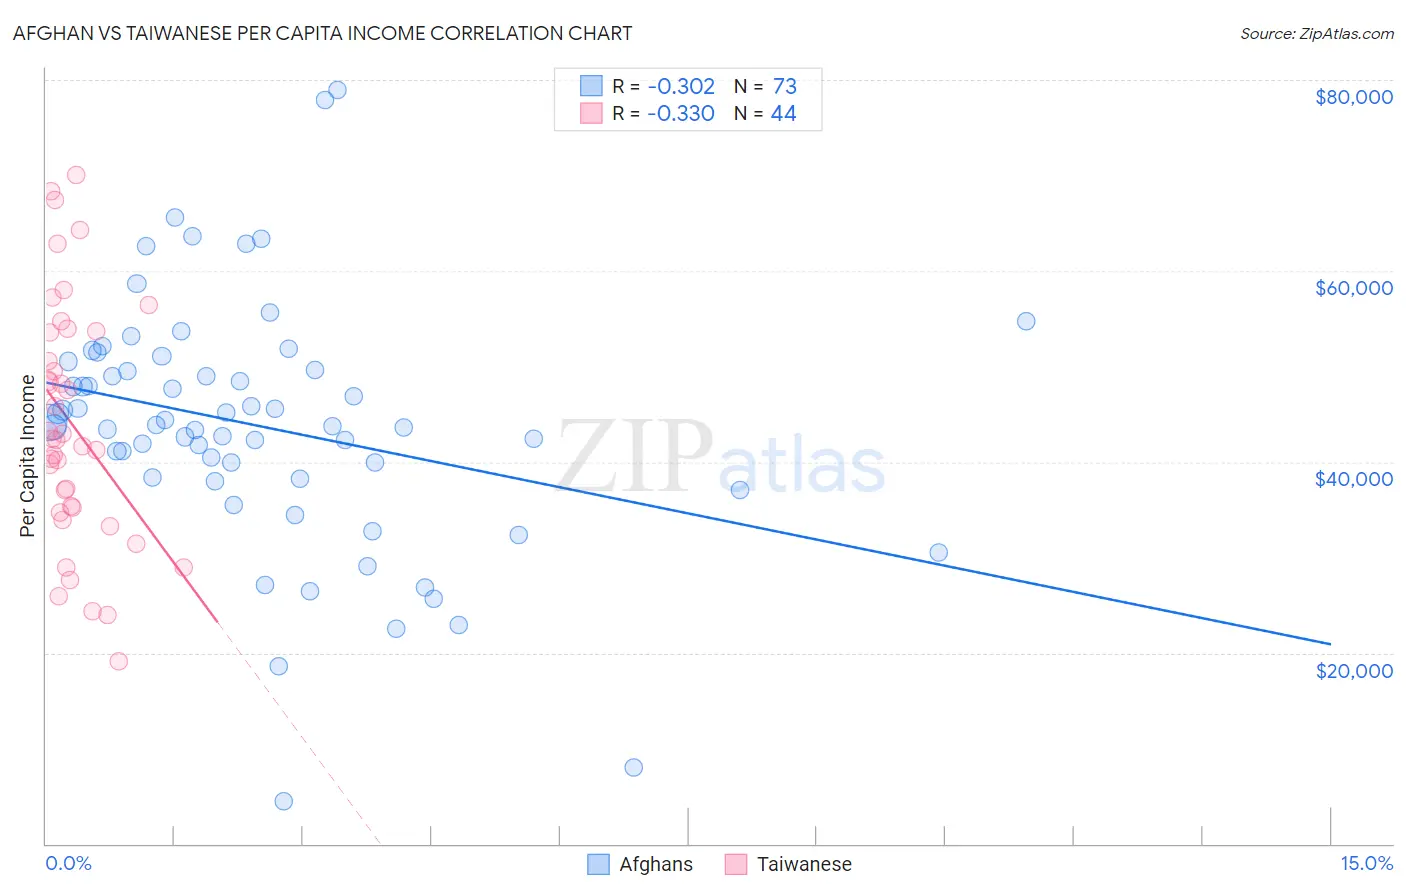
Afghan vs Taiwanese Per Capita Income Correlation Chart
The statistical analysis conducted on geographies consisting of 148,874,934 people shows a mild negative correlation between the proportion of Afghans and per capita income in the United States with a correlation coefficient (R) of -0.302 and weighted average of $46,268. Similarly, the statistical analysis conducted on geographies consisting of 31,724,936 people shows a mild negative correlation between the proportion of Taiwanese and per capita income in the United States with a correlation coefficient (R) of -0.330 and weighted average of $46,455, a difference of 0.40%.
Per Capita Income Correlation Summary
| Measurement | Afghan | Taiwanese |
| Minimum | $4,471 | $19,108 |
| Maximum | $78,942 | $70,046 |
| Range | $74,471 | $50,938 |
| Mean | $43,744 | $43,880 |
| Median | $43,810 | $42,360 |
| Interquartile 25% (IQ1) | $38,293 | $34,944 |
| Interquartile 75% (IQ3) | $50,059 | $53,629 |
| Interquartile Range (IQR) | $11,766 | $18,684 |
| Standard Deviation (Sample) | $13,009 | $12,658 |
| Standard Deviation (Population) | $12,919 | $12,514 |
Demographics Similar to Afghans and Taiwanese by Per Capita Income
In terms of per capita income, the demographic groups most similar to Afghans are Immigrants from Chile ($46,213, a difference of 0.12%), Immigrants from Albania ($46,387, a difference of 0.26%), Polish ($46,123, a difference of 0.32%), Immigrants from Morocco ($46,430, a difference of 0.35%), and Chinese ($46,098, a difference of 0.37%). Similarly, the demographic groups most similar to Taiwanese are Chilean ($46,459, a difference of 0.010%), Immigrants from Morocco ($46,430, a difference of 0.050%), Immigrants from Albania ($46,387, a difference of 0.14%), Immigrants from Northern Africa ($46,531, a difference of 0.16%), and Immigrants from Kuwait ($46,543, a difference of 0.19%).
| Demographics | Rating | Rank | Per Capita Income |
| Immigrants | Western Asia | 97.4 /100 | #102 | Exceptional $46,876 |
| Syrians | 97.2 /100 | #103 | Exceptional $46,837 |
| Brazilians | 96.8 /100 | #104 | Exceptional $46,700 |
| British | 96.3 /100 | #105 | Exceptional $46,571 |
| Ethiopians | 96.3 /100 | #106 | Exceptional $46,569 |
| Serbians | 96.2 /100 | #107 | Exceptional $46,551 |
| Immigrants | Kuwait | 96.2 /100 | #108 | Exceptional $46,543 |
| Immigrants | Northern Africa | 96.2 /100 | #109 | Exceptional $46,531 |
| Chileans | 95.9 /100 | #110 | Exceptional $46,459 |
| Taiwanese | 95.8 /100 | #111 | Exceptional $46,455 |
| Immigrants | Morocco | 95.7 /100 | #112 | Exceptional $46,430 |
| Immigrants | Albania | 95.5 /100 | #113 | Exceptional $46,387 |
| Afghans | 94.9 /100 | #114 | Exceptional $46,268 |
| Immigrants | Chile | 94.6 /100 | #115 | Exceptional $46,213 |
| Poles | 94.1 /100 | #116 | Exceptional $46,123 |
| Chinese | 93.9 /100 | #117 | Exceptional $46,098 |
| Immigrants | Saudi Arabia | 93.3 /100 | #118 | Exceptional $46,008 |
| Immigrants | Poland | 93.1 /100 | #119 | Exceptional $45,979 |
| Immigrants | Ethiopia | 92.7 /100 | #120 | Exceptional $45,923 |
| Canadians | 92.2 /100 | #121 | Exceptional $45,858 |
| Moroccans | 92.1 /100 | #122 | Exceptional $45,854 |