African vs Czechoslovakian Median Female Earnings
COMPARE
African
Czechoslovakian
Median Female Earnings
Median Female Earnings Comparison
Africans
Czechoslovakians
$36,530
MEDIAN FEMALE EARNINGS
0.1/ 100
METRIC RATING
275th/ 347
METRIC RANK
$38,738
MEDIAN FEMALE EARNINGS
12.0/ 100
METRIC RATING
210th/ 347
METRIC RANK
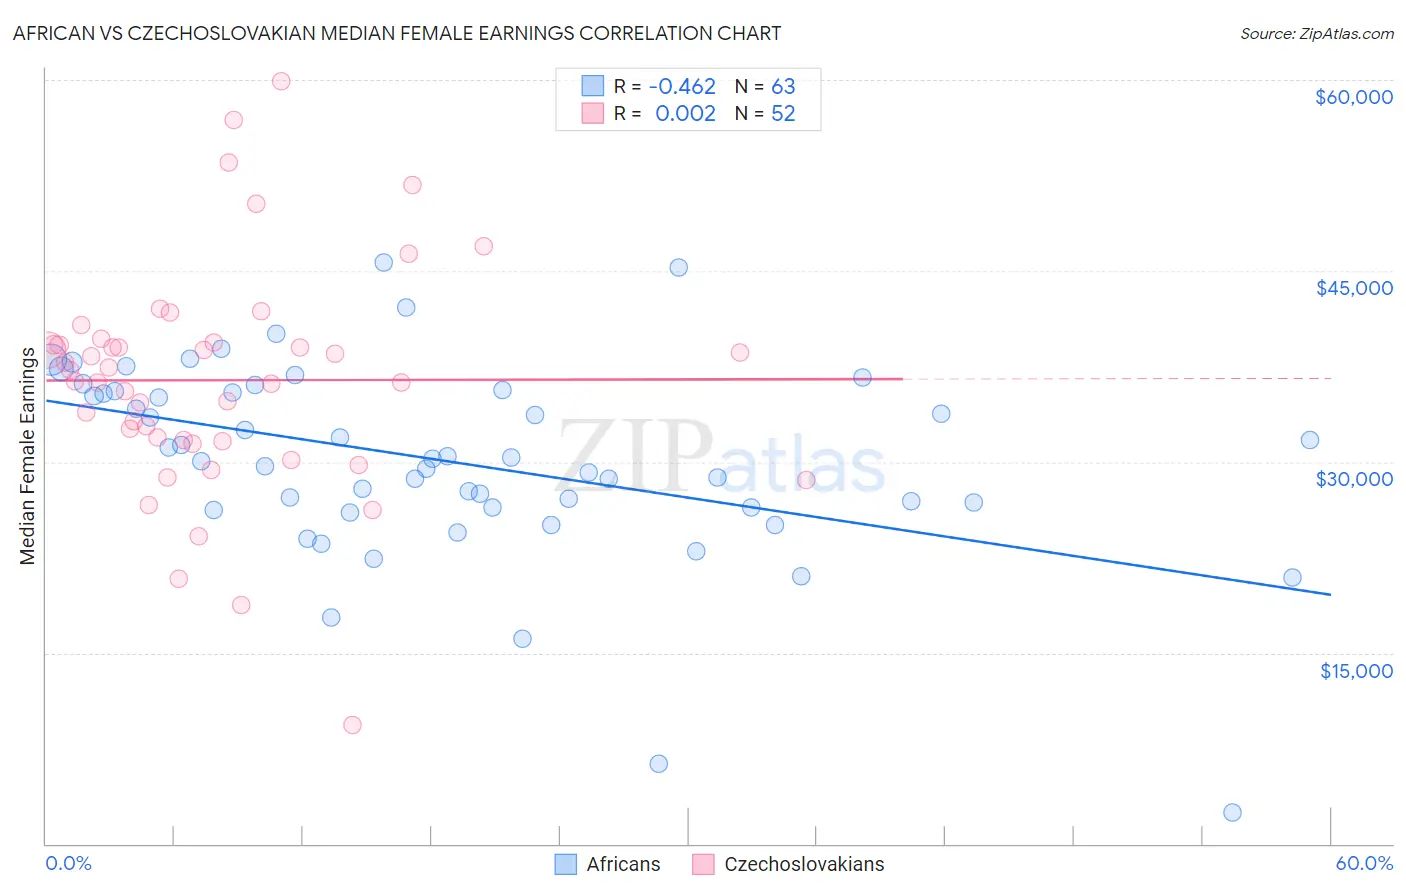
African vs Czechoslovakian Median Female Earnings Correlation Chart
The statistical analysis conducted on geographies consisting of 469,717,352 people shows a moderate negative correlation between the proportion of Africans and median female earnings in the United States with a correlation coefficient (R) of -0.462 and weighted average of $36,530. Similarly, the statistical analysis conducted on geographies consisting of 368,499,928 people shows no correlation between the proportion of Czechoslovakians and median female earnings in the United States with a correlation coefficient (R) of 0.002 and weighted average of $38,738, a difference of 6.0%.
Median Female Earnings Correlation Summary
| Measurement | African | Czechoslovakian |
| Minimum | $2,499 | $9,297 |
| Maximum | $45,656 | $59,868 |
| Range | $43,157 | $50,571 |
| Mean | $30,089 | $36,417 |
| Median | $30,270 | $36,782 |
| Interquartile 25% (IQ1) | $26,393 | $31,695 |
| Interquartile 75% (IQ3) | $35,526 | $39,301 |
| Interquartile Range (IQR) | $9,133 | $7,606 |
| Standard Deviation (Sample) | $7,747 | $8,994 |
| Standard Deviation (Population) | $7,685 | $8,907 |
Similar Demographics by Median Female Earnings
Demographics Similar to Africans by Median Female Earnings
In terms of median female earnings, the demographic groups most similar to Africans are Central American ($36,492, a difference of 0.10%), Marshallese ($36,459, a difference of 0.19%), U.S. Virgin Islander ($36,424, a difference of 0.29%), Immigrants from Caribbean ($36,414, a difference of 0.32%), and Iroquois ($36,408, a difference of 0.34%).
| Demographics | Rating | Rank | Median Female Earnings |
| Cree | 0.4 /100 | #268 | Tragic $37,018 |
| Immigrants | Venezuela | 0.4 /100 | #269 | Tragic $37,003 |
| French American Indians | 0.3 /100 | #270 | Tragic $36,920 |
| Nicaraguans | 0.3 /100 | #271 | Tragic $36,904 |
| Immigrants | Dominican Republic | 0.3 /100 | #272 | Tragic $36,857 |
| Immigrants | Laos | 0.3 /100 | #273 | Tragic $36,841 |
| Immigrants | El Salvador | 0.2 /100 | #274 | Tragic $36,673 |
| Africans | 0.1 /100 | #275 | Tragic $36,530 |
| Central Americans | 0.1 /100 | #276 | Tragic $36,492 |
| Marshallese | 0.1 /100 | #277 | Tragic $36,459 |
| U.S. Virgin Islanders | 0.1 /100 | #278 | Tragic $36,424 |
| Immigrants | Caribbean | 0.1 /100 | #279 | Tragic $36,414 |
| Iroquois | 0.1 /100 | #280 | Tragic $36,408 |
| Spanish Americans | 0.1 /100 | #281 | Tragic $36,391 |
| Haitians | 0.1 /100 | #282 | Tragic $36,374 |
Demographics Similar to Czechoslovakians by Median Female Earnings
In terms of median female earnings, the demographic groups most similar to Czechoslovakians are Aleut ($38,719, a difference of 0.050%), Guamanian/Chamorro ($38,717, a difference of 0.050%), Norwegian ($38,802, a difference of 0.17%), Jamaican ($38,670, a difference of 0.18%), and Immigrants from Thailand ($38,810, a difference of 0.19%).
| Demographics | Rating | Rank | Median Female Earnings |
| Czechs | 18.7 /100 | #203 | Poor $38,992 |
| Immigrants | Uruguay | 17.3 /100 | #204 | Poor $38,945 |
| Immigrants | Colombia | 16.3 /100 | #205 | Poor $38,913 |
| Immigrants | Bosnia and Herzegovina | 15.6 /100 | #206 | Poor $38,886 |
| Immigrants | Cambodia | 14.2 /100 | #207 | Poor $38,833 |
| Immigrants | Thailand | 13.6 /100 | #208 | Poor $38,810 |
| Norwegians | 13.4 /100 | #209 | Poor $38,802 |
| Czechoslovakians | 12.0 /100 | #210 | Poor $38,738 |
| Aleuts | 11.6 /100 | #211 | Poor $38,719 |
| Guamanians/Chamorros | 11.5 /100 | #212 | Poor $38,717 |
| Jamaicans | 10.5 /100 | #213 | Poor $38,670 |
| Iraqis | 10.5 /100 | #214 | Poor $38,666 |
| Spaniards | 10.3 /100 | #215 | Poor $38,656 |
| Immigrants | Ecuador | 10.1 /100 | #216 | Poor $38,644 |
| Immigrants | Jamaica | 9.7 /100 | #217 | Tragic $38,625 |