Aleut vs Immigrants from Trinidad and Tobago Median Male Earnings
COMPARE
Aleut
Immigrants from Trinidad and Tobago
Median Male Earnings
Median Male Earnings Comparison
Aleuts
Immigrants from Trinidad and Tobago
$51,168
MEDIAN MALE EARNINGS
3.7/ 100
METRIC RATING
233rd/ 347
METRIC RANK
$51,376
MEDIAN MALE EARNINGS
4.5/ 100
METRIC RATING
229th/ 347
METRIC RANK
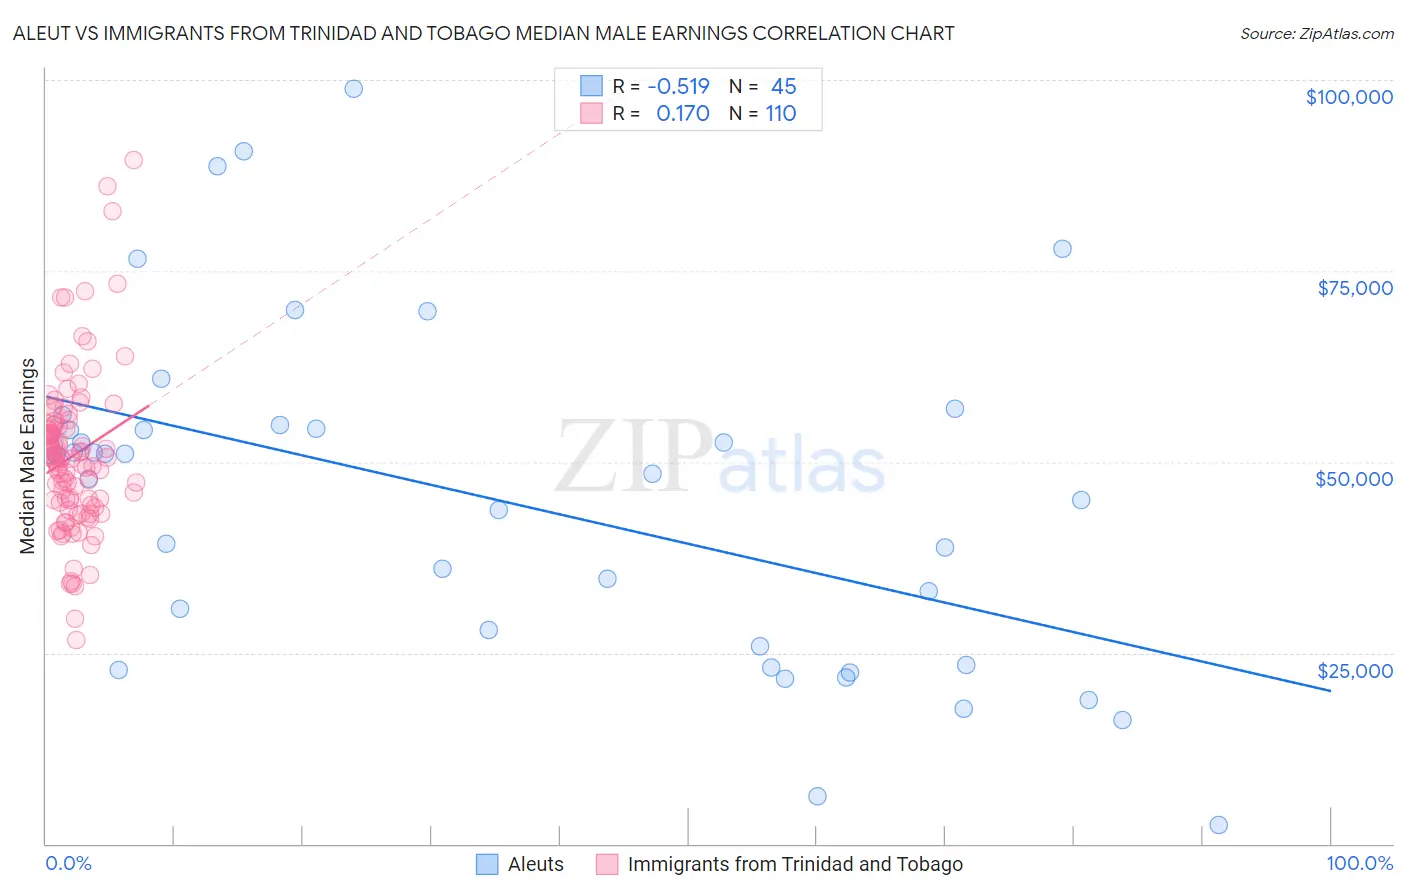
Aleut vs Immigrants from Trinidad and Tobago Median Male Earnings Correlation Chart
The statistical analysis conducted on geographies consisting of 61,765,699 people shows a substantial negative correlation between the proportion of Aleuts and median male earnings in the United States with a correlation coefficient (R) of -0.519 and weighted average of $51,168. Similarly, the statistical analysis conducted on geographies consisting of 223,506,487 people shows a poor positive correlation between the proportion of Immigrants from Trinidad and Tobago and median male earnings in the United States with a correlation coefficient (R) of 0.170 and weighted average of $51,376, a difference of 0.41%.
Median Male Earnings Correlation Summary
| Measurement | Aleut | Immigrants from Trinidad and Tobago |
| Minimum | $2,499 | $26,715 |
| Maximum | $98,906 | $89,464 |
| Range | $96,407 | $62,749 |
| Mean | $44,984 | $50,788 |
| Median | $48,500 | $50,334 |
| Interquartile 25% (IQ1) | $24,583 | $44,350 |
| Interquartile 75% (IQ3) | $54,582 | $54,816 |
| Interquartile Range (IQR) | $29,999 | $10,466 |
| Standard Deviation (Sample) | $22,008 | $10,499 |
| Standard Deviation (Population) | $21,762 | $10,451 |
Demographics Similar to Aleuts and Immigrants from Trinidad and Tobago by Median Male Earnings
In terms of median male earnings, the demographic groups most similar to Aleuts are Sudanese ($51,216, a difference of 0.090%), Barbadian ($51,236, a difference of 0.13%), Cape Verdean ($51,103, a difference of 0.13%), Immigrants from Nigeria ($51,310, a difference of 0.28%), and Samoan ($51,389, a difference of 0.43%). Similarly, the demographic groups most similar to Immigrants from Trinidad and Tobago are Samoan ($51,389, a difference of 0.030%), Immigrants from Nigeria ($51,310, a difference of 0.13%), Trinidadian and Tobagonian ($51,446, a difference of 0.14%), Japanese ($51,473, a difference of 0.19%), and Immigrants from Sudan ($51,489, a difference of 0.22%).
| Demographics | Rating | Rank | Median Male Earnings |
| Immigrants | Senegal | 5.8 /100 | #221 | Tragic $51,647 |
| Immigrants | Bangladesh | 5.8 /100 | #222 | Tragic $51,642 |
| Ecuadorians | 5.5 /100 | #223 | Tragic $51,596 |
| Immigrants | Cambodia | 5.5 /100 | #224 | Tragic $51,594 |
| Immigrants | Sudan | 5.0 /100 | #225 | Tragic $51,489 |
| Japanese | 4.9 /100 | #226 | Tragic $51,473 |
| Trinidadians and Tobagonians | 4.8 /100 | #227 | Tragic $51,446 |
| Samoans | 4.6 /100 | #228 | Tragic $51,389 |
| Immigrants | Trinidad and Tobago | 4.5 /100 | #229 | Tragic $51,376 |
| Immigrants | Nigeria | 4.2 /100 | #230 | Tragic $51,310 |
| Barbadians | 3.9 /100 | #231 | Tragic $51,236 |
| Sudanese | 3.9 /100 | #232 | Tragic $51,216 |
| Aleuts | 3.7 /100 | #233 | Tragic $51,168 |
| Cape Verdeans | 3.5 /100 | #234 | Tragic $51,103 |
| Immigrants | Western Africa | 3.0 /100 | #235 | Tragic $50,940 |
| Pennsylvania Germans | 2.8 /100 | #236 | Tragic $50,878 |
| Immigrants | Barbados | 2.6 /100 | #237 | Tragic $50,795 |
| Malaysians | 2.5 /100 | #238 | Tragic $50,772 |
| Americans | 2.5 /100 | #239 | Tragic $50,761 |
| West Indians | 2.3 /100 | #240 | Tragic $50,682 |
| Immigrants | St. Vincent and the Grenadines | 2.3 /100 | #241 | Tragic $50,665 |