Aleut vs Immigrants from West Indies Householder Income Ages 25 - 44 years
COMPARE
Aleut
Immigrants from West Indies
Householder Income Ages 25 - 44 years
Householder Income Ages 25 - 44 years Comparison
Aleuts
Immigrants from West Indies
$91,370
HOUSEHOLDER INCOME AGES 25 - 44 YEARS
14.5/ 100
METRIC RATING
206th/ 347
METRIC RANK
$87,063
HOUSEHOLDER INCOME AGES 25 - 44 YEARS
1.5/ 100
METRIC RATING
243rd/ 347
METRIC RANK
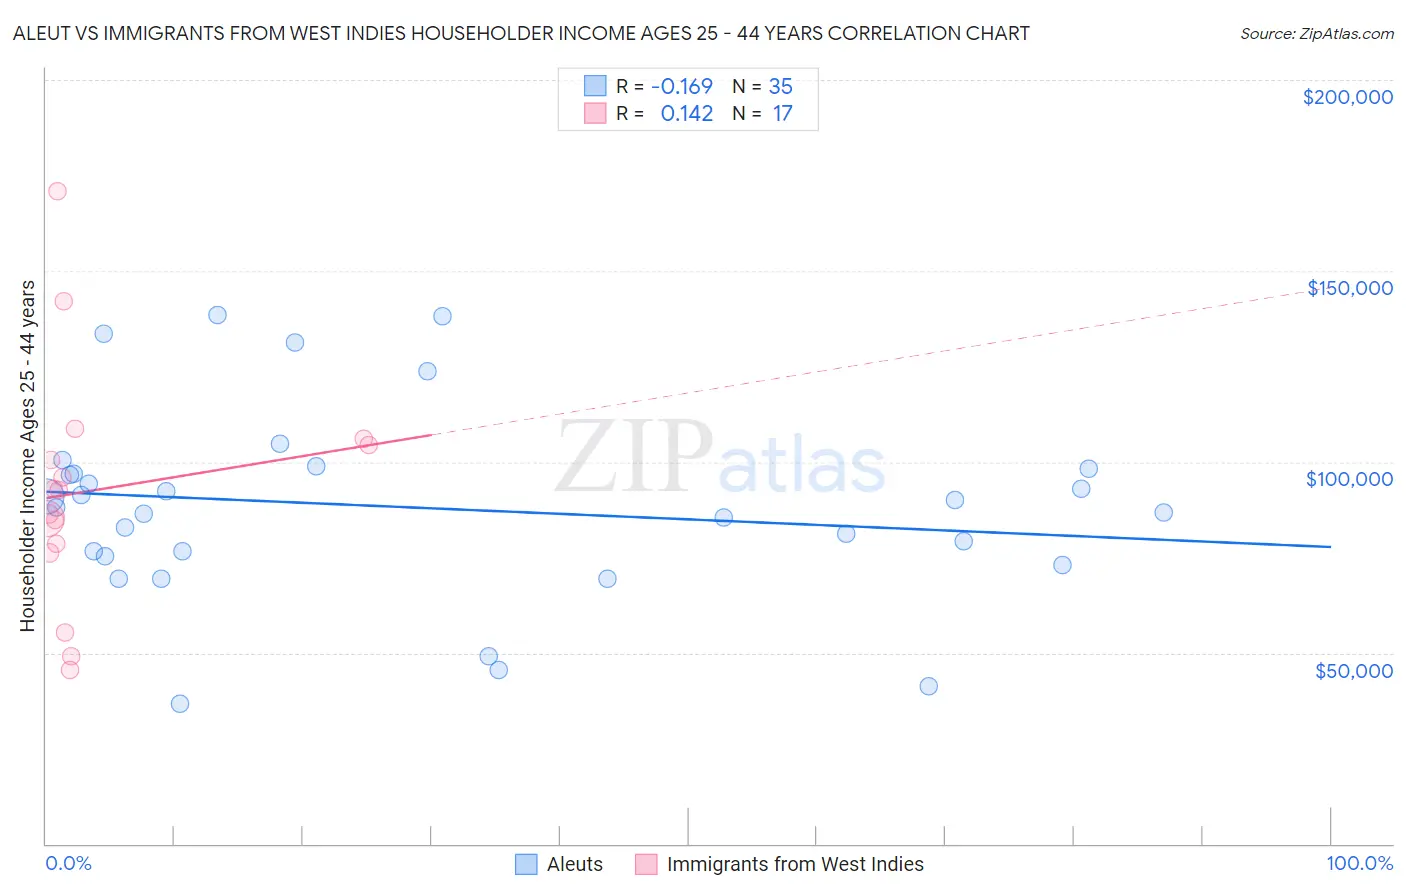
Aleut vs Immigrants from West Indies Householder Income Ages 25 - 44 years Correlation Chart
The statistical analysis conducted on geographies consisting of 61,739,915 people shows a poor negative correlation between the proportion of Aleuts and household income with householder between the ages 25 and 44 in the United States with a correlation coefficient (R) of -0.169 and weighted average of $91,370. Similarly, the statistical analysis conducted on geographies consisting of 72,445,724 people shows a poor positive correlation between the proportion of Immigrants from West Indies and household income with householder between the ages 25 and 44 in the United States with a correlation coefficient (R) of 0.142 and weighted average of $87,063, a difference of 5.0%.
Householder Income Ages 25 - 44 years Correlation Summary
| Measurement | Aleut | Immigrants from West Indies |
| Minimum | $36,667 | $45,500 |
| Maximum | $138,313 | $170,707 |
| Range | $101,646 | $125,207 |
| Mean | $88,134 | $92,620 |
| Median | $88,006 | $92,679 |
| Interquartile 25% (IQ1) | $75,410 | $77,312 |
| Interquartile 75% (IQ3) | $98,125 | $105,207 |
| Interquartile Range (IQR) | $22,715 | $27,895 |
| Standard Deviation (Sample) | $24,944 | $30,962 |
| Standard Deviation (Population) | $24,585 | $30,037 |
Similar Demographics by Householder Income Ages 25 - 44 years
Demographics Similar to Aleuts by Householder Income Ages 25 - 44 years
In terms of householder income ages 25 - 44 years, the demographic groups most similar to Aleuts are Yugoslavian ($91,368, a difference of 0.0%), Immigrants from Thailand ($91,337, a difference of 0.040%), Immigrants from Eastern Africa ($91,458, a difference of 0.10%), Nepalese ($91,498, a difference of 0.14%), and Immigrants from Cambodia ($91,533, a difference of 0.18%).
| Demographics | Rating | Rank | Householder Income Ages 25 - 44 years |
| Kenyans | 16.8 /100 | #199 | Poor $91,684 |
| Whites/Caucasians | 16.7 /100 | #200 | Poor $91,668 |
| Japanese | 16.4 /100 | #201 | Poor $91,624 |
| Ecuadorians | 16.0 /100 | #202 | Poor $91,574 |
| Immigrants | Cambodia | 15.7 /100 | #203 | Poor $91,533 |
| Nepalese | 15.4 /100 | #204 | Poor $91,498 |
| Immigrants | Eastern Africa | 15.2 /100 | #205 | Poor $91,458 |
| Aleuts | 14.5 /100 | #206 | Poor $91,370 |
| Yugoslavians | 14.5 /100 | #207 | Poor $91,368 |
| Immigrants | Thailand | 14.3 /100 | #208 | Poor $91,337 |
| Immigrants | Uruguay | 13.2 /100 | #209 | Poor $91,171 |
| Immigrants | Kenya | 10.9 /100 | #210 | Poor $90,767 |
| Iraqis | 10.8 /100 | #211 | Poor $90,764 |
| Hawaiians | 10.6 /100 | #212 | Poor $90,722 |
| Immigrants | Bangladesh | 9.3 /100 | #213 | Tragic $90,448 |
Demographics Similar to Immigrants from West Indies by Householder Income Ages 25 - 44 years
In terms of householder income ages 25 - 44 years, the demographic groups most similar to Immigrants from West Indies are Immigrants from Venezuela ($87,038, a difference of 0.030%), West Indian ($87,205, a difference of 0.16%), Immigrants from El Salvador ($86,913, a difference of 0.17%), Immigrants from Burma/Myanmar ($86,736, a difference of 0.38%), and Immigrants from Nigeria ($86,589, a difference of 0.55%).
| Demographics | Rating | Rank | Householder Income Ages 25 - 44 years |
| Immigrants | Cameroon | 2.9 /100 | #236 | Tragic $88,214 |
| Salvadorans | 2.8 /100 | #237 | Tragic $88,198 |
| Alaska Natives | 2.6 /100 | #238 | Tragic $88,018 |
| Immigrants | Ghana | 2.2 /100 | #239 | Tragic $87,760 |
| Nicaraguans | 2.2 /100 | #240 | Tragic $87,751 |
| Nigerians | 2.2 /100 | #241 | Tragic $87,730 |
| West Indians | 1.7 /100 | #242 | Tragic $87,205 |
| Immigrants | West Indies | 1.5 /100 | #243 | Tragic $87,063 |
| Immigrants | Venezuela | 1.5 /100 | #244 | Tragic $87,038 |
| Immigrants | El Salvador | 1.4 /100 | #245 | Tragic $86,913 |
| Immigrants | Burma/Myanmar | 1.3 /100 | #246 | Tragic $86,736 |
| Immigrants | Nigeria | 1.2 /100 | #247 | Tragic $86,589 |
| Immigrants | Sudan | 0.9 /100 | #248 | Tragic $86,109 |
| French American Indians | 0.8 /100 | #249 | Tragic $85,899 |
| Pennsylvania Germans | 0.8 /100 | #250 | Tragic $85,836 |