Alsatian vs Israeli Householder Income Under 25 years
COMPARE
Alsatian
Israeli
Householder Income Under 25 years
Householder Income Under 25 years Comparison
Alsatians
Israelis
$49,267
HOUSEHOLDER INCOME UNDER 25 YEARS
0.1/ 100
METRIC RATING
282nd/ 347
METRIC RANK
$52,335
HOUSEHOLDER INCOME UNDER 25 YEARS
58.8/ 100
METRIC RATING
170th/ 347
METRIC RANK
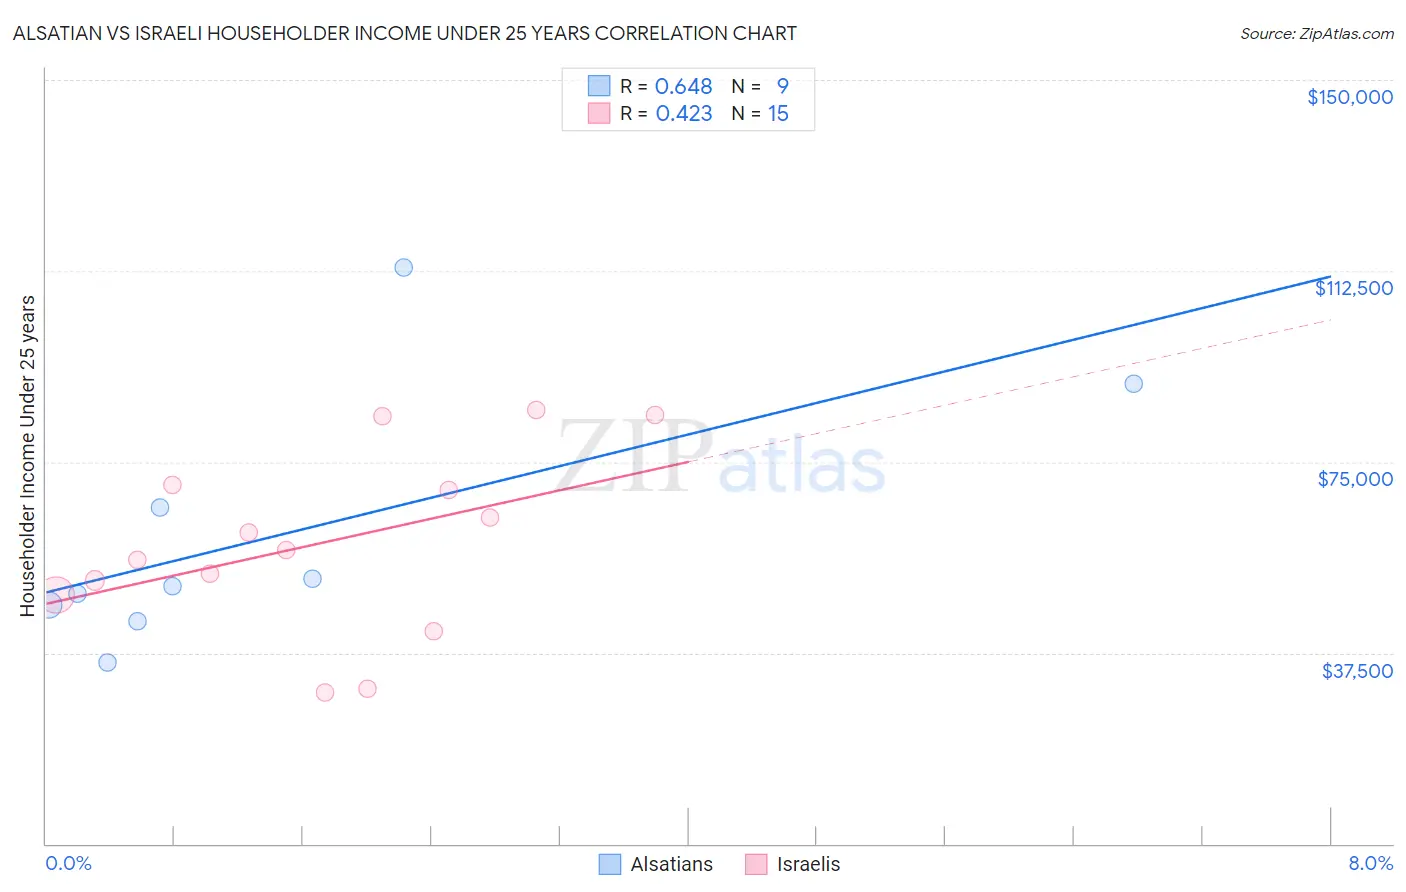
Alsatian vs Israeli Householder Income Under 25 years Correlation Chart
The statistical analysis conducted on geographies consisting of 77,564,981 people shows a significant positive correlation between the proportion of Alsatians and household income with householder under the age of 25 in the United States with a correlation coefficient (R) of 0.648 and weighted average of $49,267. Similarly, the statistical analysis conducted on geographies consisting of 185,385,963 people shows a moderate positive correlation between the proportion of Israelis and household income with householder under the age of 25 in the United States with a correlation coefficient (R) of 0.423 and weighted average of $52,335, a difference of 6.2%.
Householder Income Under 25 years Correlation Summary
| Measurement | Alsatian | Israeli |
| Minimum | $35,598 | $29,603 |
| Maximum | $113,281 | $85,068 |
| Range | $77,683 | $55,465 |
| Mean | $60,844 | $59,148 |
| Median | $50,662 | $57,661 |
| Interquartile 25% (IQ1) | $45,251 | $48,868 |
| Interquartile 75% (IQ3) | $78,194 | $70,580 |
| Interquartile Range (IQR) | $32,943 | $21,712 |
| Standard Deviation (Sample) | $25,229 | $17,724 |
| Standard Deviation (Population) | $23,786 | $17,123 |
Similar Demographics by Householder Income Under 25 years
Demographics Similar to Alsatians by Householder Income Under 25 years
In terms of householder income under 25 years, the demographic groups most similar to Alsatians are Nonimmigrants ($49,348, a difference of 0.16%), Immigrants from Nigeria ($49,174, a difference of 0.19%), Hmong ($49,364, a difference of 0.20%), Apache ($49,395, a difference of 0.26%), and Nigerian ($49,416, a difference of 0.30%).
| Demographics | Rating | Rank | Householder Income Under 25 years |
| Immigrants | Kenya | 0.2 /100 | #275 | Tragic $49,633 |
| Dominicans | 0.2 /100 | #276 | Tragic $49,633 |
| Immigrants | Western Africa | 0.2 /100 | #277 | Tragic $49,621 |
| Nigerians | 0.1 /100 | #278 | Tragic $49,416 |
| Apache | 0.1 /100 | #279 | Tragic $49,395 |
| Hmong | 0.1 /100 | #280 | Tragic $49,364 |
| Immigrants | Nonimmigrants | 0.1 /100 | #281 | Tragic $49,348 |
| Alsatians | 0.1 /100 | #282 | Tragic $49,267 |
| Immigrants | Nigeria | 0.1 /100 | #283 | Tragic $49,174 |
| Carpatho Rusyns | 0.1 /100 | #284 | Tragic $49,113 |
| Scotch-Irish | 0.0 /100 | #285 | Tragic $49,039 |
| French American Indians | 0.0 /100 | #286 | Tragic $48,977 |
| Senegalese | 0.0 /100 | #287 | Tragic $48,953 |
| Liberians | 0.0 /100 | #288 | Tragic $48,917 |
| Hondurans | 0.0 /100 | #289 | Tragic $48,885 |
Demographics Similar to Israelis by Householder Income Under 25 years
In terms of householder income under 25 years, the demographic groups most similar to Israelis are Canadian ($52,336, a difference of 0.0%), Japanese ($52,365, a difference of 0.060%), Immigrants from Uruguay ($52,302, a difference of 0.060%), Immigrants from Uganda ($52,374, a difference of 0.070%), and Immigrants from Austria ($52,400, a difference of 0.12%).
| Demographics | Rating | Rank | Householder Income Under 25 years |
| Immigrants | Chile | 64.8 /100 | #163 | Good $52,440 |
| Immigrants | Trinidad and Tobago | 64.7 /100 | #164 | Good $52,437 |
| Poles | 63.0 /100 | #165 | Good $52,407 |
| Immigrants | Austria | 62.6 /100 | #166 | Good $52,400 |
| Immigrants | Uganda | 61.1 /100 | #167 | Good $52,374 |
| Japanese | 60.5 /100 | #168 | Good $52,365 |
| Canadians | 58.8 /100 | #169 | Average $52,336 |
| Israelis | 58.8 /100 | #170 | Average $52,335 |
| Immigrants | Uruguay | 56.8 /100 | #171 | Average $52,302 |
| Cypriots | 51.2 /100 | #172 | Average $52,209 |
| Barbadians | 50.8 /100 | #173 | Average $52,202 |
| Immigrants | Western Asia | 50.0 /100 | #174 | Average $52,190 |
| Immigrants | Zimbabwe | 33.8 /100 | #175 | Fair $51,914 |
| Austrians | 32.9 /100 | #176 | Fair $51,898 |
| British West Indians | 30.0 /100 | #177 | Fair $51,844 |