Armenian vs Immigrants from Caribbean Median Household Income
COMPARE
Armenian
Immigrants from Caribbean
Median Household Income
Median Household Income Comparison
Armenians
Immigrants from Caribbean
$91,807
MEDIAN HOUSEHOLD INCOME
98.7/ 100
METRIC RATING
95th/ 347
METRIC RANK
$71,860
MEDIAN HOUSEHOLD INCOME
0.0/ 100
METRIC RATING
309th/ 347
METRIC RANK
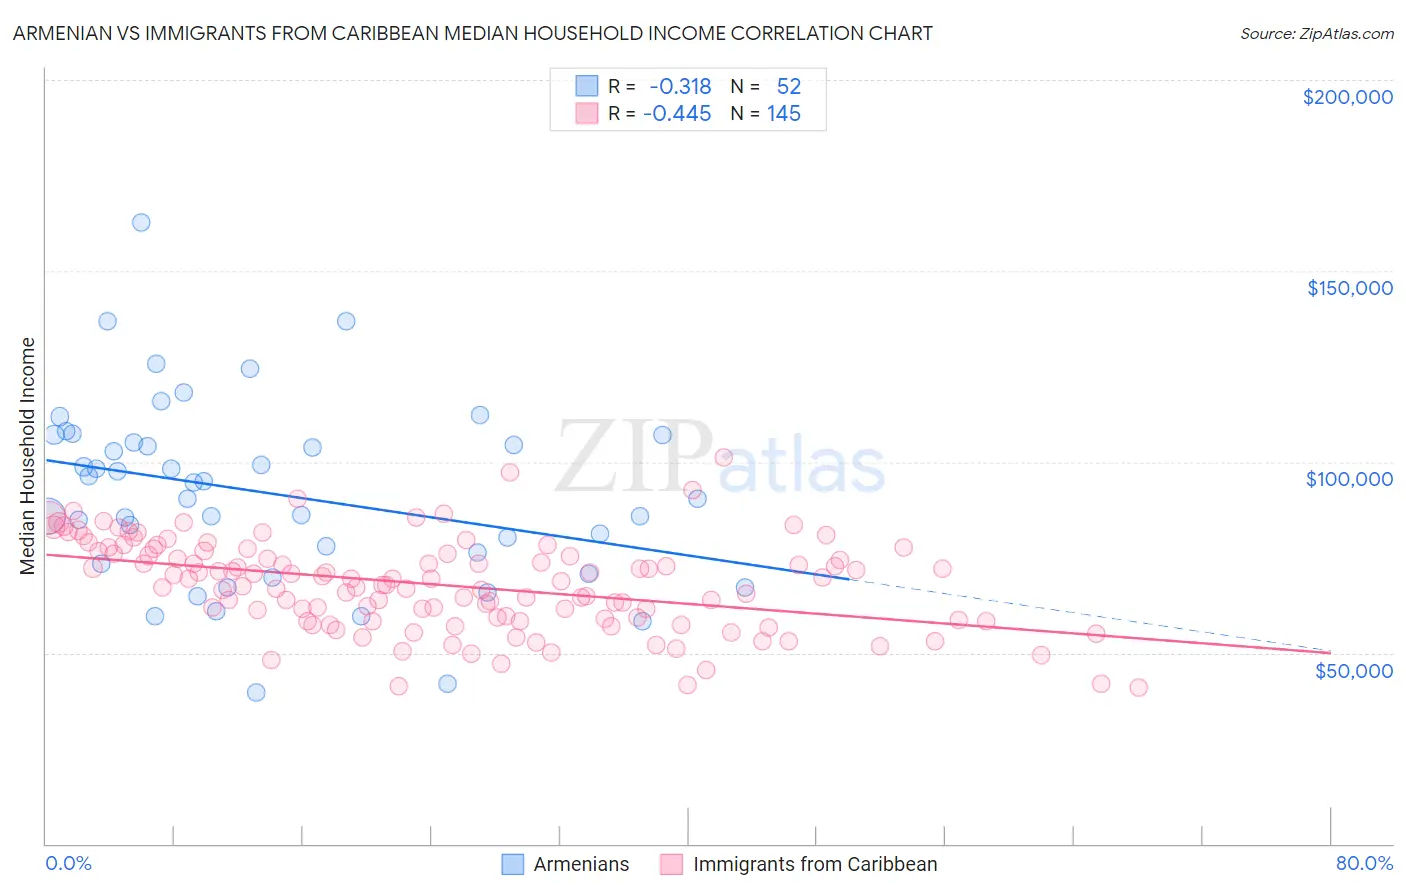
Armenian vs Immigrants from Caribbean Median Household Income Correlation Chart
The statistical analysis conducted on geographies consisting of 310,713,421 people shows a mild negative correlation between the proportion of Armenians and median household income in the United States with a correlation coefficient (R) of -0.318 and weighted average of $91,807. Similarly, the statistical analysis conducted on geographies consisting of 449,492,713 people shows a moderate negative correlation between the proportion of Immigrants from Caribbean and median household income in the United States with a correlation coefficient (R) of -0.445 and weighted average of $71,860, a difference of 27.8%.
Median Household Income Correlation Summary
| Measurement | Armenian | Immigrants from Caribbean |
| Minimum | $39,713 | $41,053 |
| Maximum | $162,732 | $101,042 |
| Range | $123,019 | $59,989 |
| Mean | $91,613 | $67,787 |
| Median | $92,502 | $68,717 |
| Interquartile 25% (IQ1) | $74,815 | $58,750 |
| Interquartile 75% (IQ3) | $106,031 | $76,359 |
| Interquartile Range (IQR) | $31,215 | $17,609 |
| Standard Deviation (Sample) | $24,104 | $11,824 |
| Standard Deviation (Population) | $23,871 | $11,783 |
Similar Demographics by Median Household Income
Demographics Similar to Armenians by Median Household Income
In terms of median household income, the demographic groups most similar to Armenians are Jordanian ($91,794, a difference of 0.010%), Immigrants from North America ($91,860, a difference of 0.060%), Immigrants from Serbia ($91,730, a difference of 0.080%), Immigrants from Lebanon ($91,887, a difference of 0.090%), and Immigrants from Western Europe ($91,936, a difference of 0.14%).
| Demographics | Rating | Rank | Median Household Income |
| Immigrants | Canada | 98.8 /100 | #88 | Exceptional $92,029 |
| Romanians | 98.8 /100 | #89 | Exceptional $91,994 |
| Assyrians/Chaldeans/Syriacs | 98.8 /100 | #90 | Exceptional $91,991 |
| Immigrants | Vietnam | 98.8 /100 | #91 | Exceptional $91,987 |
| Immigrants | Western Europe | 98.8 /100 | #92 | Exceptional $91,936 |
| Immigrants | Lebanon | 98.7 /100 | #93 | Exceptional $91,887 |
| Immigrants | North America | 98.7 /100 | #94 | Exceptional $91,860 |
| Armenians | 98.7 /100 | #95 | Exceptional $91,807 |
| Jordanians | 98.7 /100 | #96 | Exceptional $91,794 |
| Immigrants | Serbia | 98.6 /100 | #97 | Exceptional $91,730 |
| Immigrants | Southern Europe | 98.5 /100 | #98 | Exceptional $91,605 |
| Immigrants | South Eastern Asia | 98.4 /100 | #99 | Exceptional $91,541 |
| Ukrainians | 98.3 /100 | #100 | Exceptional $91,456 |
| Immigrants | Moldova | 98.3 /100 | #101 | Exceptional $91,446 |
| Austrians | 98.2 /100 | #102 | Exceptional $91,339 |
Demographics Similar to Immigrants from Caribbean by Median Household Income
In terms of median household income, the demographic groups most similar to Immigrants from Caribbean are U.S. Virgin Islander ($71,853, a difference of 0.010%), Immigrants from Zaire ($71,801, a difference of 0.080%), Yakama ($72,225, a difference of 0.51%), Immigrants from Honduras ($71,452, a difference of 0.57%), and Immigrants from Bahamas ($71,349, a difference of 0.72%).
| Demographics | Rating | Rank | Median Household Income |
| Shoshone | 0.0 /100 | #302 | Tragic $72,660 |
| Africans | 0.0 /100 | #303 | Tragic $72,650 |
| Immigrants | Haiti | 0.0 /100 | #304 | Tragic $72,599 |
| Hondurans | 0.0 /100 | #305 | Tragic $72,588 |
| Potawatomi | 0.0 /100 | #306 | Tragic $72,576 |
| Ute | 0.0 /100 | #307 | Tragic $72,402 |
| Yakama | 0.0 /100 | #308 | Tragic $72,225 |
| Immigrants | Caribbean | 0.0 /100 | #309 | Tragic $71,860 |
| U.S. Virgin Islanders | 0.0 /100 | #310 | Tragic $71,853 |
| Immigrants | Zaire | 0.0 /100 | #311 | Tragic $71,801 |
| Immigrants | Honduras | 0.0 /100 | #312 | Tragic $71,452 |
| Immigrants | Bahamas | 0.0 /100 | #313 | Tragic $71,349 |
| Dominicans | 0.0 /100 | #314 | Tragic $71,302 |
| Ottawa | 0.0 /100 | #315 | Tragic $70,984 |
| Apache | 0.0 /100 | #316 | Tragic $70,927 |