Assyrian/Chaldean/Syriac vs Immigrants from Lebanon Householder Income Ages 45 - 64 years
COMPARE
Assyrian/Chaldean/Syriac
Immigrants from Lebanon
Householder Income Ages 45 - 64 years
Householder Income Ages 45 - 64 years Comparison
Assyrians/Chaldeans/Syriacs
Immigrants from Lebanon
$110,201
HOUSEHOLDER INCOME AGES 45 - 64 YEARS
99.3/ 100
METRIC RATING
72nd/ 347
METRIC RANK
$108,471
HOUSEHOLDER INCOME AGES 45 - 64 YEARS
98.3/ 100
METRIC RATING
91st/ 347
METRIC RANK
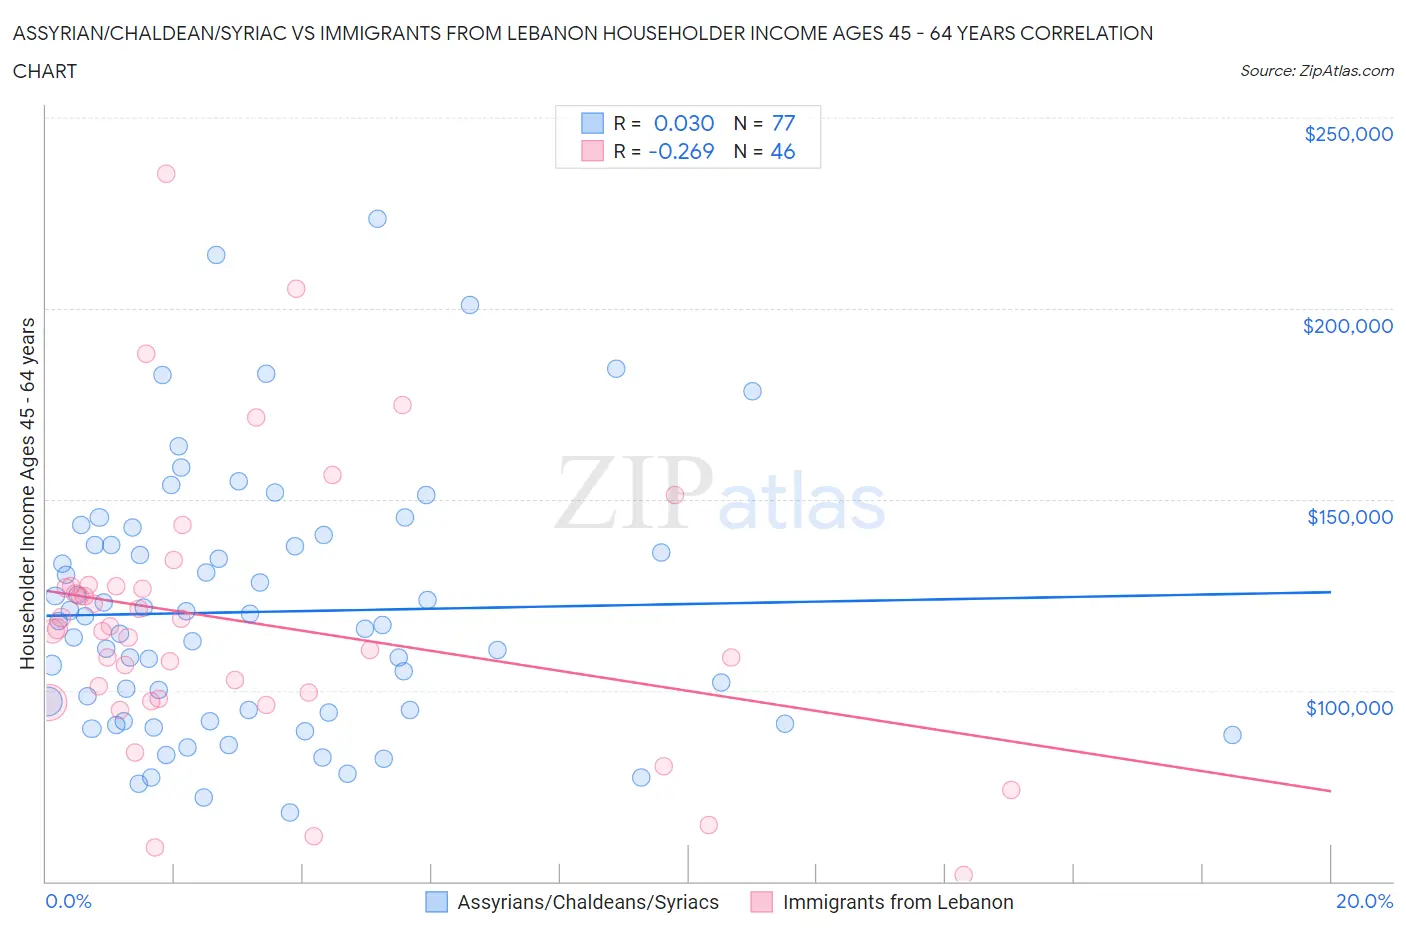
Assyrian/Chaldean/Syriac vs Immigrants from Lebanon Householder Income Ages 45 - 64 years Correlation Chart
The statistical analysis conducted on geographies consisting of 110,244,252 people shows no correlation between the proportion of Assyrians/Chaldeans/Syriacs and household income with householder between the ages 45 and 64 in the United States with a correlation coefficient (R) of 0.030 and weighted average of $110,201. Similarly, the statistical analysis conducted on geographies consisting of 217,063,471 people shows a weak negative correlation between the proportion of Immigrants from Lebanon and household income with householder between the ages 45 and 64 in the United States with a correlation coefficient (R) of -0.269 and weighted average of $108,471, a difference of 1.6%.
Householder Income Ages 45 - 64 years Correlation Summary
| Measurement | Assyrian/Chaldean/Syriac | Immigrants from Lebanon |
| Minimum | $67,992 | $51,559 |
| Maximum | $223,409 | $235,112 |
| Range | $155,417 | $183,553 |
| Mean | $120,547 | $118,072 |
| Median | $117,054 | $115,795 |
| Interquartile 25% (IQ1) | $93,085 | $97,661 |
| Interquartile 75% (IQ3) | $138,155 | $127,190 |
| Interquartile Range (IQR) | $45,070 | $29,528 |
| Standard Deviation (Sample) | $33,489 | $36,074 |
| Standard Deviation (Population) | $33,271 | $35,680 |
Demographics Similar to Assyrians/Chaldeans/Syriacs and Immigrants from Lebanon by Householder Income Ages 45 - 64 years
In terms of householder income ages 45 - 64 years, the demographic groups most similar to Assyrians/Chaldeans/Syriacs are Italian ($110,224, a difference of 0.020%), Argentinean ($110,103, a difference of 0.090%), Immigrants from Egypt ($109,941, a difference of 0.24%), South African ($109,719, a difference of 0.44%), and Paraguayan ($109,447, a difference of 0.69%). Similarly, the demographic groups most similar to Immigrants from Lebanon are Ukrainian ($108,475, a difference of 0.0%), Immigrants from Philippines ($108,471, a difference of 0.0%), Romanian ($108,609, a difference of 0.13%), Tongan ($108,643, a difference of 0.16%), and Austrian ($108,692, a difference of 0.20%).
| Demographics | Rating | Rank | Householder Income Ages 45 - 64 years |
| Italians | 99.3 /100 | #71 | Exceptional $110,224 |
| Assyrians/Chaldeans/Syriacs | 99.3 /100 | #72 | Exceptional $110,201 |
| Argentineans | 99.3 /100 | #73 | Exceptional $110,103 |
| Immigrants | Egypt | 99.2 /100 | #74 | Exceptional $109,941 |
| South Africans | 99.1 /100 | #75 | Exceptional $109,719 |
| Paraguayans | 99.0 /100 | #76 | Exceptional $109,447 |
| Immigrants | England | 99.0 /100 | #77 | Exceptional $109,446 |
| Immigrants | Canada | 99.0 /100 | #78 | Exceptional $109,402 |
| Immigrants | Bulgaria | 98.9 /100 | #79 | Exceptional $109,379 |
| Jordanians | 98.9 /100 | #80 | Exceptional $109,376 |
| Immigrants | Eastern Europe | 98.9 /100 | #81 | Exceptional $109,335 |
| Immigrants | North America | 98.8 /100 | #82 | Exceptional $109,198 |
| Immigrants | Spain | 98.8 /100 | #83 | Exceptional $109,051 |
| Immigrants | Western Europe | 98.6 /100 | #84 | Exceptional $108,824 |
| Immigrants | Afghanistan | 98.6 /100 | #85 | Exceptional $108,785 |
| Austrians | 98.5 /100 | #86 | Exceptional $108,692 |
| Tongans | 98.5 /100 | #87 | Exceptional $108,643 |
| Romanians | 98.5 /100 | #88 | Exceptional $108,609 |
| Ukrainians | 98.3 /100 | #89 | Exceptional $108,475 |
| Immigrants | Philippines | 98.3 /100 | #90 | Exceptional $108,471 |
| Immigrants | Lebanon | 98.3 /100 | #91 | Exceptional $108,471 |