Bahamian vs Indonesian Householder Income Ages 45 - 64 years
COMPARE
Bahamian
Indonesian
Householder Income Ages 45 - 64 years
Householder Income Ages 45 - 64 years Comparison
Bahamians
Indonesians
$81,369
HOUSEHOLDER INCOME AGES 45 - 64 YEARS
0.0/ 100
METRIC RATING
323rd/ 347
METRIC RANK
$84,890
HOUSEHOLDER INCOME AGES 45 - 64 YEARS
0.0/ 100
METRIC RATING
300th/ 347
METRIC RANK
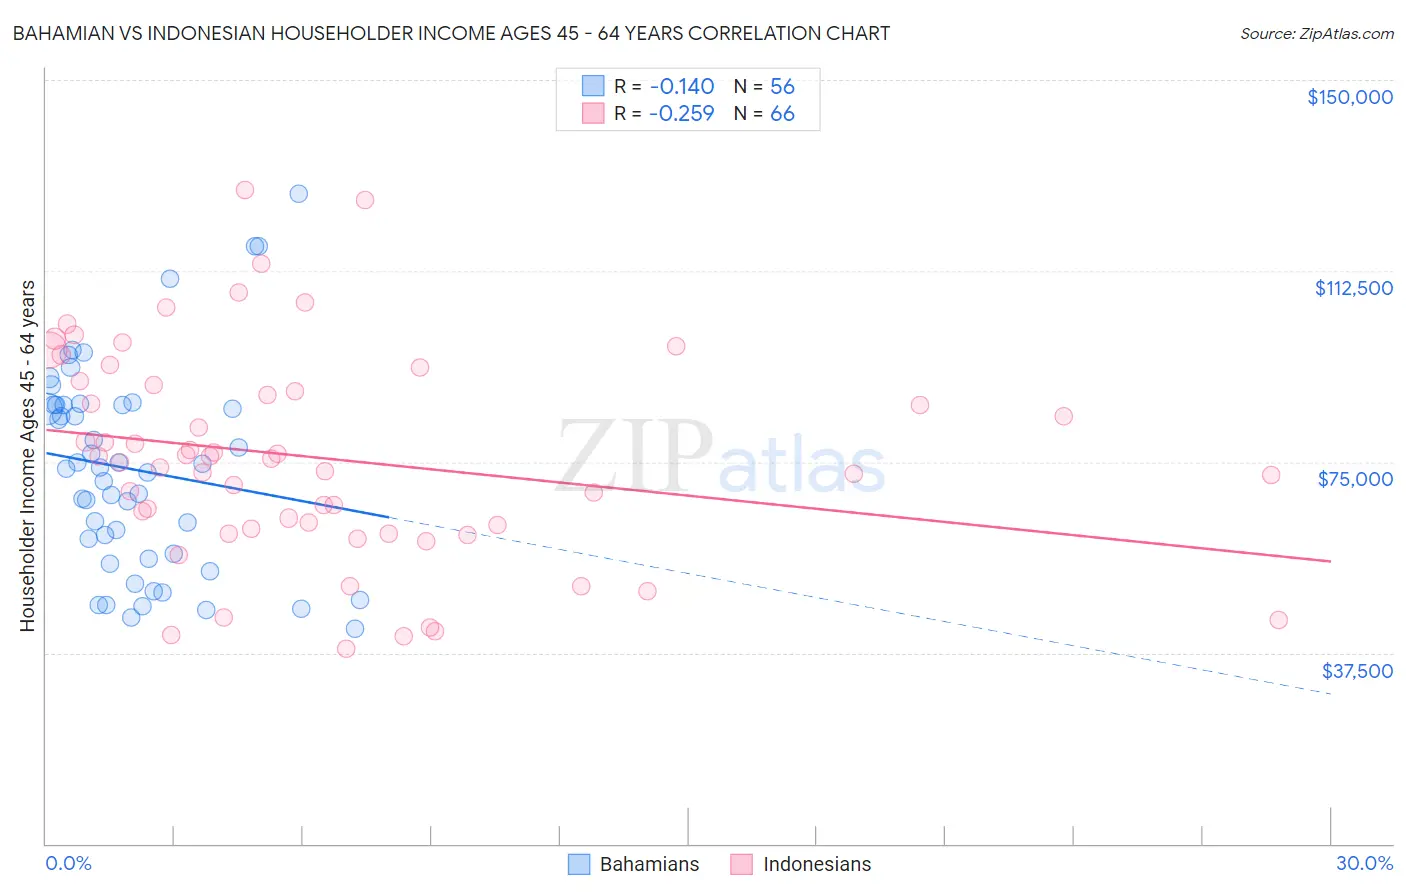
Bahamian vs Indonesian Householder Income Ages 45 - 64 years Correlation Chart
The statistical analysis conducted on geographies consisting of 112,556,125 people shows a poor negative correlation between the proportion of Bahamians and household income with householder between the ages 45 and 64 in the United States with a correlation coefficient (R) of -0.140 and weighted average of $81,369. Similarly, the statistical analysis conducted on geographies consisting of 162,545,681 people shows a weak negative correlation between the proportion of Indonesians and household income with householder between the ages 45 and 64 in the United States with a correlation coefficient (R) of -0.259 and weighted average of $84,890, a difference of 4.3%.
Householder Income Ages 45 - 64 years Correlation Summary
| Measurement | Bahamian | Indonesian |
| Minimum | $42,237 | $38,314 |
| Maximum | $127,688 | $128,309 |
| Range | $85,451 | $89,995 |
| Mean | $73,458 | $75,761 |
| Median | $73,730 | $75,282 |
| Interquartile 25% (IQ1) | $56,503 | $61,778 |
| Interquartile 75% (IQ3) | $86,250 | $90,077 |
| Interquartile Range (IQR) | $29,747 | $28,299 |
| Standard Deviation (Sample) | $20,194 | $20,717 |
| Standard Deviation (Population) | $20,012 | $20,559 |
Similar Demographics by Householder Income Ages 45 - 64 years
Demographics Similar to Bahamians by Householder Income Ages 45 - 64 years
In terms of householder income ages 45 - 64 years, the demographic groups most similar to Bahamians are Yup'ik ($81,000, a difference of 0.46%), Sioux ($81,750, a difference of 0.47%), Immigrants from Cuba ($80,662, a difference of 0.88%), Dominican ($80,623, a difference of 0.92%), and Yuman ($82,139, a difference of 0.95%).
| Demographics | Rating | Rank | Householder Income Ages 45 - 64 years |
| Immigrants | Caribbean | 0.0 /100 | #316 | Tragic $82,513 |
| Colville | 0.0 /100 | #317 | Tragic $82,474 |
| Choctaw | 0.0 /100 | #318 | Tragic $82,287 |
| Chickasaw | 0.0 /100 | #319 | Tragic $82,193 |
| Apache | 0.0 /100 | #320 | Tragic $82,184 |
| Yuman | 0.0 /100 | #321 | Tragic $82,139 |
| Sioux | 0.0 /100 | #322 | Tragic $81,750 |
| Bahamians | 0.0 /100 | #323 | Tragic $81,369 |
| Yup'ik | 0.0 /100 | #324 | Tragic $81,000 |
| Immigrants | Cuba | 0.0 /100 | #325 | Tragic $80,662 |
| Dominicans | 0.0 /100 | #326 | Tragic $80,623 |
| Seminole | 0.0 /100 | #327 | Tragic $80,077 |
| Natives/Alaskans | 0.0 /100 | #328 | Tragic $79,816 |
| Dutch West Indians | 0.0 /100 | #329 | Tragic $79,171 |
| Creek | 0.0 /100 | #330 | Tragic $78,960 |
Demographics Similar to Indonesians by Householder Income Ages 45 - 64 years
In terms of householder income ages 45 - 64 years, the demographic groups most similar to Indonesians are Immigrants from Mexico ($84,910, a difference of 0.020%), African ($84,925, a difference of 0.040%), Potawatomi ($84,613, a difference of 0.33%), Fijian ($85,187, a difference of 0.35%), and Immigrants from Zaire ($85,207, a difference of 0.37%).
| Demographics | Rating | Rank | Householder Income Ages 45 - 64 years |
| Comanche | 0.1 /100 | #293 | Tragic $85,787 |
| British West Indians | 0.1 /100 | #294 | Tragic $85,571 |
| Immigrants | Grenada | 0.1 /100 | #295 | Tragic $85,552 |
| Immigrants | Zaire | 0.1 /100 | #296 | Tragic $85,207 |
| Fijians | 0.1 /100 | #297 | Tragic $85,187 |
| Africans | 0.0 /100 | #298 | Tragic $84,925 |
| Immigrants | Mexico | 0.0 /100 | #299 | Tragic $84,910 |
| Indonesians | 0.0 /100 | #300 | Tragic $84,890 |
| Potawatomi | 0.0 /100 | #301 | Tragic $84,613 |
| Haitians | 0.0 /100 | #302 | Tragic $84,384 |
| Hondurans | 0.0 /100 | #303 | Tragic $84,079 |
| Ottawa | 0.0 /100 | #304 | Tragic $83,953 |
| Chippewa | 0.0 /100 | #305 | Tragic $83,943 |
| Ute | 0.0 /100 | #306 | Tragic $83,937 |
| Shoshone | 0.0 /100 | #307 | Tragic $83,588 |