Belizean vs British Householder Income Ages 45 - 64 years
COMPARE
Belizean
British
Householder Income Ages 45 - 64 years
Householder Income Ages 45 - 64 years Comparison
Belizeans
British
$88,684
HOUSEHOLDER INCOME AGES 45 - 64 YEARS
0.3/ 100
METRIC RATING
261st/ 347
METRIC RANK
$106,264
HOUSEHOLDER INCOME AGES 45 - 64 YEARS
95.2/ 100
METRIC RATING
116th/ 347
METRIC RANK
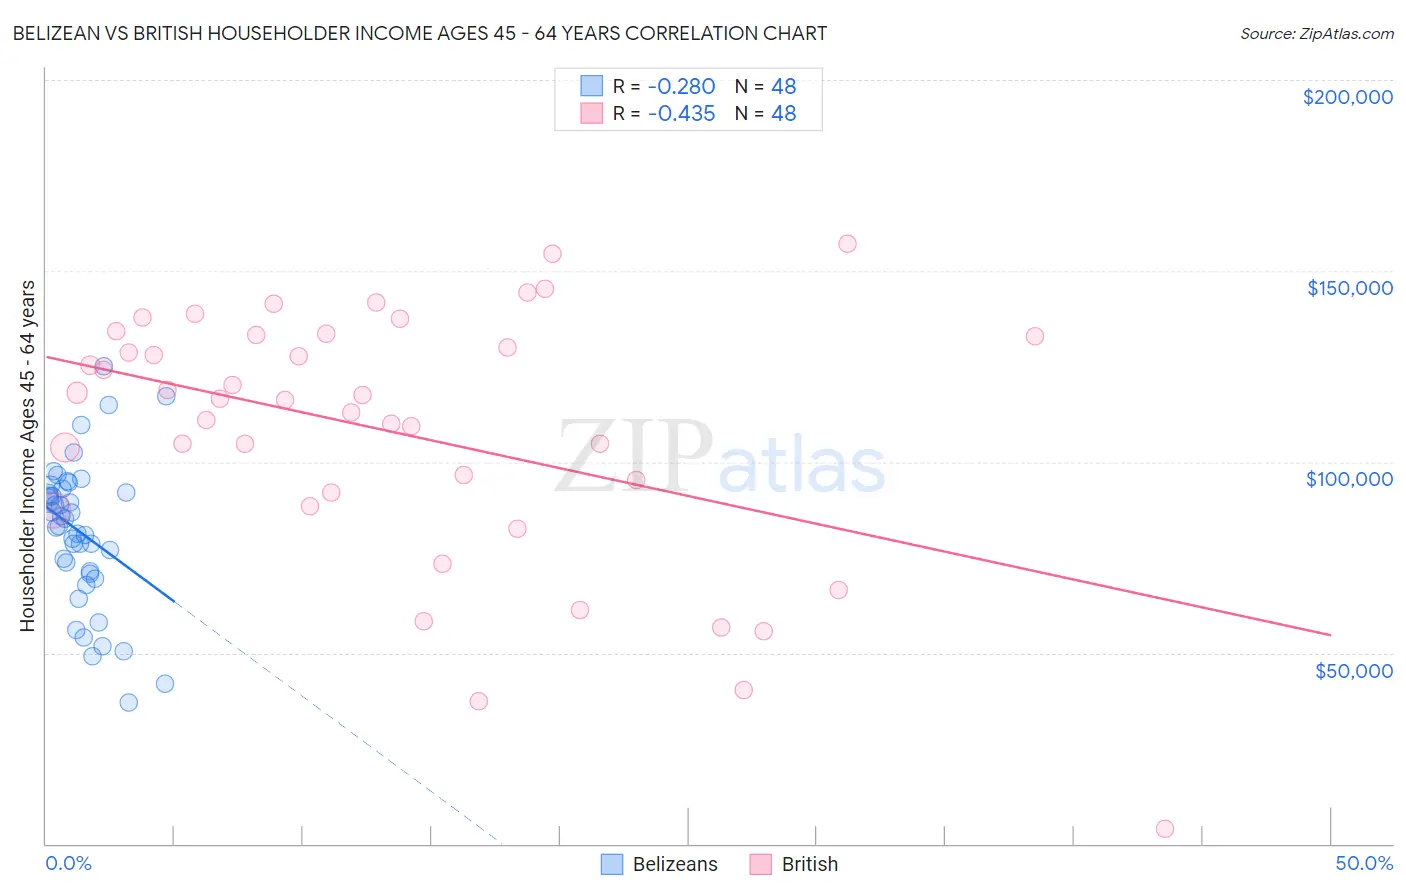
Belizean vs British Householder Income Ages 45 - 64 years Correlation Chart
The statistical analysis conducted on geographies consisting of 144,082,540 people shows a weak negative correlation between the proportion of Belizeans and household income with householder between the ages 45 and 64 in the United States with a correlation coefficient (R) of -0.280 and weighted average of $88,684. Similarly, the statistical analysis conducted on geographies consisting of 529,409,230 people shows a moderate negative correlation between the proportion of British and household income with householder between the ages 45 and 64 in the United States with a correlation coefficient (R) of -0.435 and weighted average of $106,264, a difference of 19.8%.
Householder Income Ages 45 - 64 years Correlation Summary
| Measurement | Belizean | British |
| Minimum | $37,000 | $3,946 |
| Maximum | $124,977 | $157,159 |
| Range | $87,977 | $153,213 |
| Mean | $81,502 | $107,499 |
| Median | $84,116 | $116,378 |
| Interquartile 25% (IQ1) | $70,959 | $90,097 |
| Interquartile 75% (IQ3) | $92,338 | $132,967 |
| Interquartile Range (IQR) | $21,379 | $42,871 |
| Standard Deviation (Sample) | $18,999 | $33,617 |
| Standard Deviation (Population) | $18,800 | $33,265 |
Similar Demographics by Householder Income Ages 45 - 64 years
Demographics Similar to Belizeans by Householder Income Ages 45 - 64 years
In terms of householder income ages 45 - 64 years, the demographic groups most similar to Belizeans are Somali ($88,600, a difference of 0.090%), Liberian ($88,929, a difference of 0.28%), Immigrants from Senegal ($88,421, a difference of 0.30%), Osage ($88,390, a difference of 0.33%), and Jamaican ($88,327, a difference of 0.40%).
| Demographics | Rating | Rank | Householder Income Ages 45 - 64 years |
| Immigrants | Guyana | 0.6 /100 | #254 | Tragic $90,186 |
| West Indians | 0.5 /100 | #255 | Tragic $89,906 |
| French American Indians | 0.5 /100 | #256 | Tragic $89,811 |
| German Russians | 0.4 /100 | #257 | Tragic $89,398 |
| Immigrants | Barbados | 0.4 /100 | #258 | Tragic $89,394 |
| Immigrants | Nicaragua | 0.4 /100 | #259 | Tragic $89,108 |
| Liberians | 0.3 /100 | #260 | Tragic $88,929 |
| Belizeans | 0.3 /100 | #261 | Tragic $88,684 |
| Somalis | 0.3 /100 | #262 | Tragic $88,600 |
| Immigrants | Senegal | 0.3 /100 | #263 | Tragic $88,421 |
| Osage | 0.3 /100 | #264 | Tragic $88,390 |
| Jamaicans | 0.2 /100 | #265 | Tragic $88,327 |
| Immigrants | West Indies | 0.2 /100 | #266 | Tragic $88,164 |
| Hmong | 0.2 /100 | #267 | Tragic $88,115 |
| Immigrants | Micronesia | 0.2 /100 | #268 | Tragic $87,864 |
Demographics Similar to British by Householder Income Ages 45 - 64 years
In terms of householder income ages 45 - 64 years, the demographic groups most similar to British are Immigrants from Kuwait ($106,285, a difference of 0.020%), Albanian ($106,243, a difference of 0.020%), Immigrants from Western Asia ($106,217, a difference of 0.040%), Immigrants from Poland ($106,319, a difference of 0.050%), and Immigrants from Jordan ($106,164, a difference of 0.090%).
| Demographics | Rating | Rank | Householder Income Ages 45 - 64 years |
| Chileans | 95.9 /100 | #109 | Exceptional $106,611 |
| Immigrants | Brazil | 95.6 /100 | #110 | Exceptional $106,470 |
| Immigrants | Vietnam | 95.5 /100 | #111 | Exceptional $106,417 |
| Swedes | 95.4 /100 | #112 | Exceptional $106,377 |
| Europeans | 95.4 /100 | #113 | Exceptional $106,367 |
| Immigrants | Poland | 95.3 /100 | #114 | Exceptional $106,319 |
| Immigrants | Kuwait | 95.2 /100 | #115 | Exceptional $106,285 |
| British | 95.2 /100 | #116 | Exceptional $106,264 |
| Albanians | 95.1 /100 | #117 | Exceptional $106,243 |
| Immigrants | Western Asia | 95.0 /100 | #118 | Exceptional $106,217 |
| Immigrants | Jordan | 94.9 /100 | #119 | Exceptional $106,164 |
| Immigrants | South Eastern Asia | 94.8 /100 | #120 | Exceptional $106,109 |
| Poles | 94.4 /100 | #121 | Exceptional $105,952 |
| Immigrants | North Macedonia | 94.2 /100 | #122 | Exceptional $105,892 |
| Danes | 93.4 /100 | #123 | Exceptional $105,619 |