Bolivian vs Nepalese Householder Income Ages 45 - 64 years
COMPARE
Bolivian
Nepalese
Householder Income Ages 45 - 64 years
Householder Income Ages 45 - 64 years Comparison
Bolivians
Nepalese
$118,871
HOUSEHOLDER INCOME AGES 45 - 64 YEARS
100.0/ 100
METRIC RATING
23rd/ 347
METRIC RANK
$93,355
HOUSEHOLDER INCOME AGES 45 - 64 YEARS
3.0/ 100
METRIC RATING
233rd/ 347
METRIC RANK
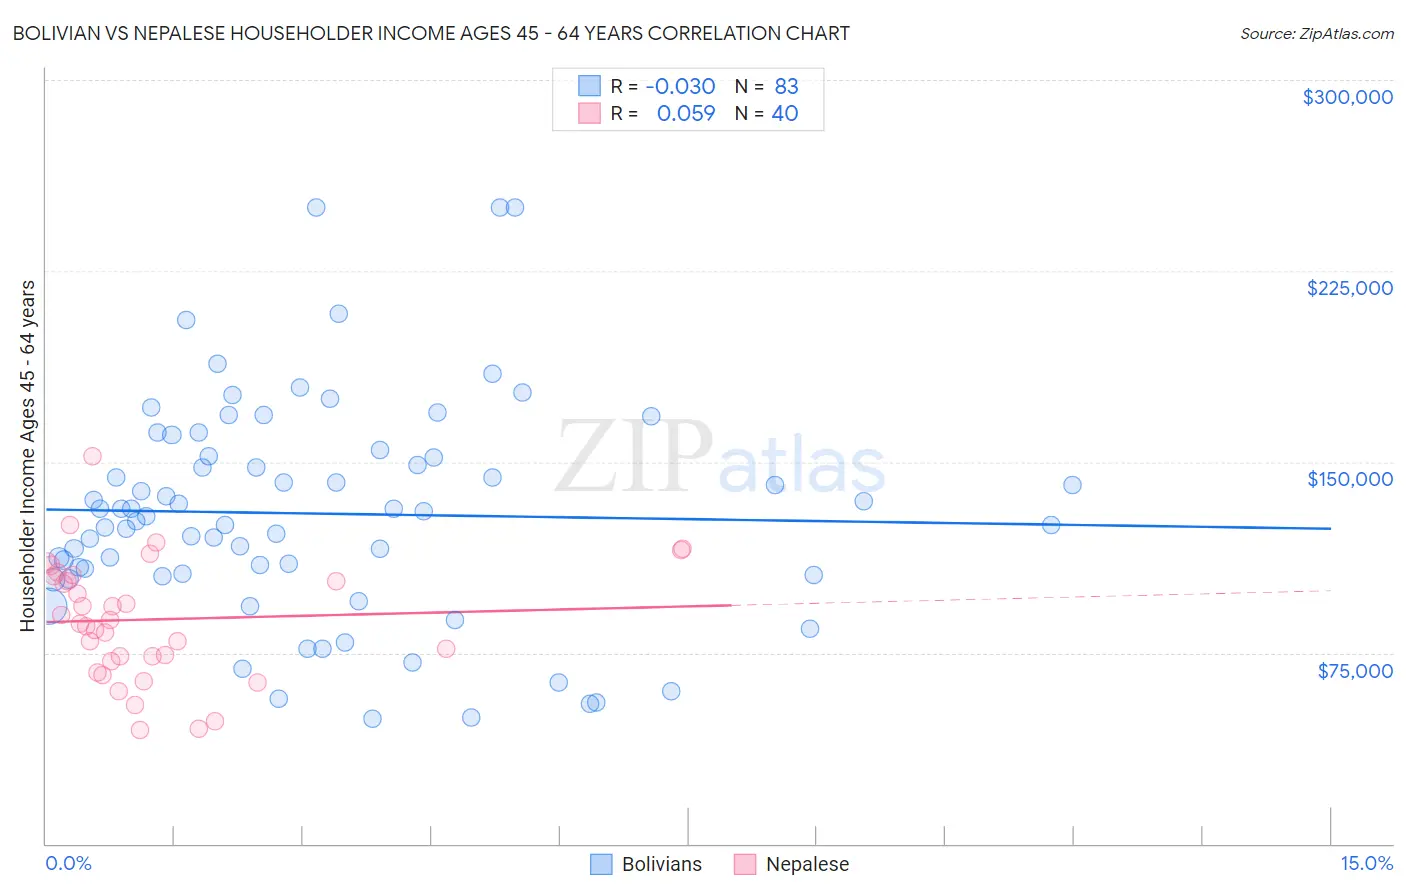
Bolivian vs Nepalese Householder Income Ages 45 - 64 years Correlation Chart
The statistical analysis conducted on geographies consisting of 184,583,472 people shows no correlation between the proportion of Bolivians and household income with householder between the ages 45 and 64 in the United States with a correlation coefficient (R) of -0.030 and weighted average of $118,871. Similarly, the statistical analysis conducted on geographies consisting of 24,521,755 people shows a slight positive correlation between the proportion of Nepalese and household income with householder between the ages 45 and 64 in the United States with a correlation coefficient (R) of 0.059 and weighted average of $93,355, a difference of 27.3%.
Householder Income Ages 45 - 64 years Correlation Summary
| Measurement | Bolivian | Nepalese |
| Minimum | $49,123 | $44,758 |
| Maximum | $250,001 | $152,367 |
| Range | $200,878 | $107,609 |
| Mean | $129,661 | $88,143 |
| Median | $128,631 | $87,241 |
| Interquartile 25% (IQ1) | $105,688 | $72,874 |
| Interquartile 75% (IQ3) | $152,268 | $105,294 |
| Interquartile Range (IQR) | $46,580 | $32,420 |
| Standard Deviation (Sample) | $43,264 | $23,682 |
| Standard Deviation (Population) | $43,003 | $23,385 |
Similar Demographics by Householder Income Ages 45 - 64 years
Demographics Similar to Bolivians by Householder Income Ages 45 - 64 years
In terms of householder income ages 45 - 64 years, the demographic groups most similar to Bolivians are Immigrants from Belgium ($118,932, a difference of 0.050%), Immigrants from Sri Lanka ($119,094, a difference of 0.19%), Immigrants from Japan ($118,498, a difference of 0.32%), Immigrants from Australia ($119,308, a difference of 0.37%), and Asian ($118,426, a difference of 0.38%).
| Demographics | Rating | Rank | Householder Income Ages 45 - 64 years |
| Immigrants | China | 100.0 /100 | #16 | Exceptional $122,178 |
| Burmese | 100.0 /100 | #17 | Exceptional $121,444 |
| Immigrants | Korea | 100.0 /100 | #18 | Exceptional $121,243 |
| Eastern Europeans | 100.0 /100 | #19 | Exceptional $120,684 |
| Immigrants | Australia | 100.0 /100 | #20 | Exceptional $119,308 |
| Immigrants | Sri Lanka | 100.0 /100 | #21 | Exceptional $119,094 |
| Immigrants | Belgium | 100.0 /100 | #22 | Exceptional $118,932 |
| Bolivians | 100.0 /100 | #23 | Exceptional $118,871 |
| Immigrants | Japan | 100.0 /100 | #24 | Exceptional $118,498 |
| Asians | 100.0 /100 | #25 | Exceptional $118,426 |
| Immigrants | Sweden | 100.0 /100 | #26 | Exceptional $118,318 |
| Immigrants | Northern Europe | 100.0 /100 | #27 | Exceptional $117,930 |
| Turks | 100.0 /100 | #28 | Exceptional $117,814 |
| Bhutanese | 100.0 /100 | #29 | Exceptional $117,750 |
| Immigrants | Bolivia | 100.0 /100 | #30 | Exceptional $117,731 |
Demographics Similar to Nepalese by Householder Income Ages 45 - 64 years
In terms of householder income ages 45 - 64 years, the demographic groups most similar to Nepalese are Immigrants from El Salvador ($93,176, a difference of 0.19%), Sudanese ($93,718, a difference of 0.39%), Ecuadorian ($93,739, a difference of 0.41%), Vietnamese ($93,788, a difference of 0.46%), and Immigrants from Sudan ($93,781, a difference of 0.46%).
| Demographics | Rating | Rank | Householder Income Ages 45 - 64 years |
| Immigrants | Azores | 4.3 /100 | #226 | Tragic $94,138 |
| Alaska Natives | 4.0 /100 | #227 | Tragic $93,991 |
| Immigrants | Panama | 3.7 /100 | #228 | Tragic $93,815 |
| Vietnamese | 3.6 /100 | #229 | Tragic $93,788 |
| Immigrants | Sudan | 3.6 /100 | #230 | Tragic $93,781 |
| Ecuadorians | 3.6 /100 | #231 | Tragic $93,739 |
| Sudanese | 3.5 /100 | #232 | Tragic $93,718 |
| Nepalese | 3.0 /100 | #233 | Tragic $93,355 |
| Immigrants | El Salvador | 2.7 /100 | #234 | Tragic $93,176 |
| Nicaraguans | 2.0 /100 | #235 | Tragic $92,554 |
| Immigrants | Western Africa | 1.8 /100 | #236 | Tragic $92,384 |
| Immigrants | Bangladesh | 1.7 /100 | #237 | Tragic $92,208 |
| Pennsylvania Germans | 1.5 /100 | #238 | Tragic $91,956 |
| Immigrants | Ecuador | 1.2 /100 | #239 | Tragic $91,462 |
| Immigrants | Burma/Myanmar | 1.1 /100 | #240 | Tragic $91,385 |