Bolivian vs Slovak Householder Income Ages 25 - 44 years
COMPARE
Bolivian
Slovak
Householder Income Ages 25 - 44 years
Householder Income Ages 25 - 44 years Comparison
Bolivians
Slovaks
$109,372
HOUSEHOLDER INCOME AGES 25 - 44 YEARS
100.0/ 100
METRIC RATING
34th/ 347
METRIC RANK
$95,032
HOUSEHOLDER INCOME AGES 25 - 44 YEARS
56.4/ 100
METRIC RATING
170th/ 347
METRIC RANK
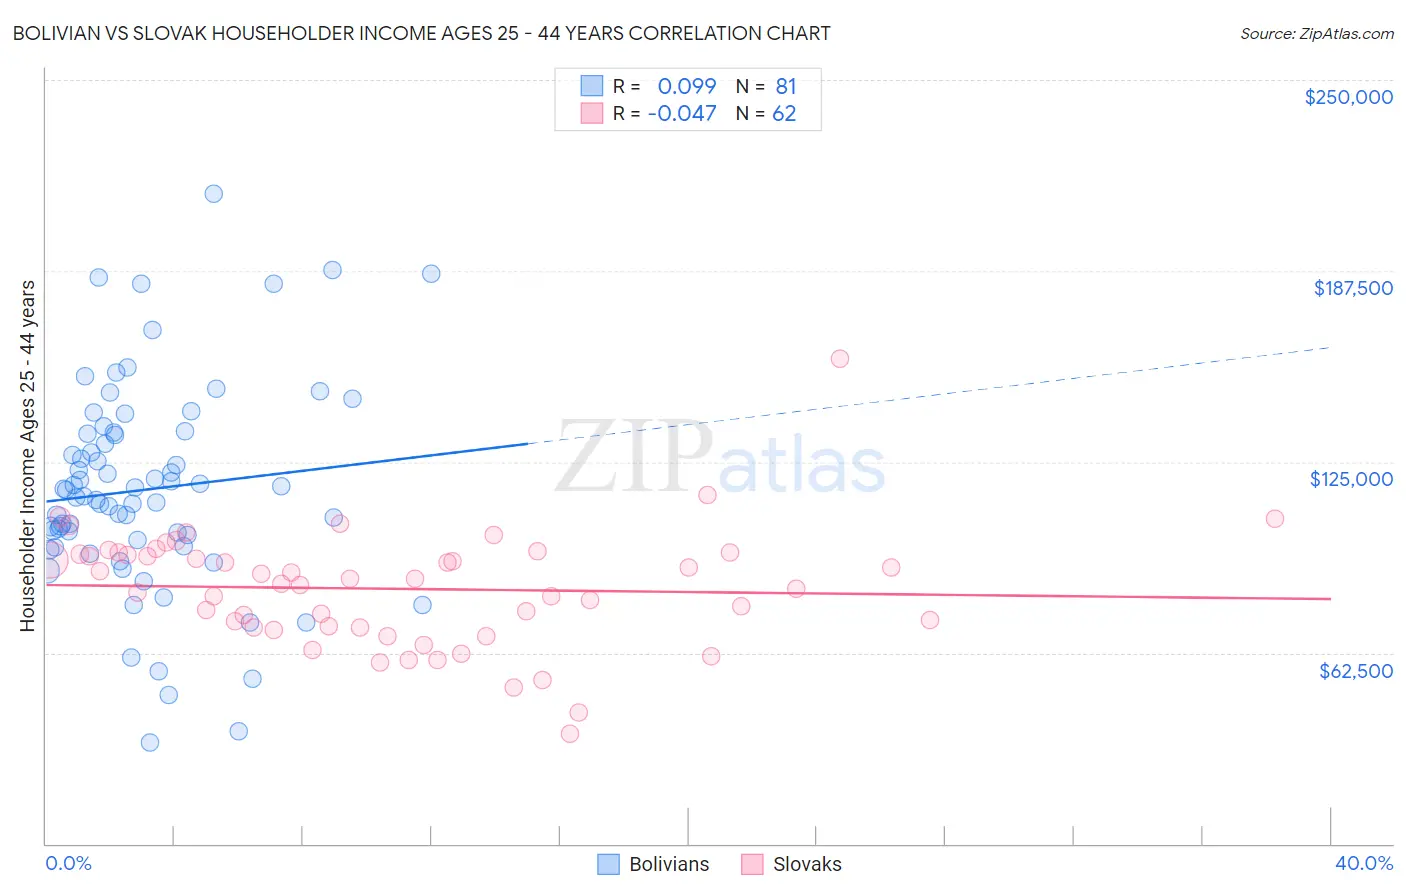
Bolivian vs Slovak Householder Income Ages 25 - 44 years Correlation Chart
The statistical analysis conducted on geographies consisting of 184,532,310 people shows a slight positive correlation between the proportion of Bolivians and household income with householder between the ages 25 and 44 in the United States with a correlation coefficient (R) of 0.099 and weighted average of $109,372. Similarly, the statistical analysis conducted on geographies consisting of 396,481,004 people shows no correlation between the proportion of Slovaks and household income with householder between the ages 25 and 44 in the United States with a correlation coefficient (R) of -0.047 and weighted average of $95,032, a difference of 15.1%.
Householder Income Ages 25 - 44 years Correlation Summary
| Measurement | Bolivian | Slovak |
| Minimum | $33,063 | $35,806 |
| Maximum | $212,696 | $158,804 |
| Range | $179,633 | $122,998 |
| Mean | $115,960 | $83,438 |
| Median | $113,745 | $85,825 |
| Interquartile 25% (IQ1) | $98,450 | $70,673 |
| Interquartile 75% (IQ3) | $134,298 | $94,793 |
| Interquartile Range (IQR) | $35,848 | $24,121 |
| Standard Deviation (Sample) | $33,954 | $19,171 |
| Standard Deviation (Population) | $33,744 | $19,016 |
Similar Demographics by Householder Income Ages 25 - 44 years
Demographics Similar to Bolivians by Householder Income Ages 25 - 44 years
In terms of householder income ages 25 - 44 years, the demographic groups most similar to Bolivians are Bhutanese ($109,520, a difference of 0.13%), Immigrants from Switzerland ($109,185, a difference of 0.17%), Immigrants from Sri Lanka ($109,741, a difference of 0.34%), Latvian ($108,926, a difference of 0.41%), and Immigrants from Russia ($108,751, a difference of 0.57%).
| Demographics | Rating | Rank | Householder Income Ages 25 - 44 years |
| Russians | 100.0 /100 | #27 | Exceptional $110,398 |
| Immigrants | Denmark | 100.0 /100 | #28 | Exceptional $110,363 |
| Turks | 100.0 /100 | #29 | Exceptional $110,318 |
| Immigrants | Greece | 100.0 /100 | #30 | Exceptional $110,103 |
| Maltese | 100.0 /100 | #31 | Exceptional $110,064 |
| Immigrants | Sri Lanka | 100.0 /100 | #32 | Exceptional $109,741 |
| Bhutanese | 100.0 /100 | #33 | Exceptional $109,520 |
| Bolivians | 100.0 /100 | #34 | Exceptional $109,372 |
| Immigrants | Switzerland | 100.0 /100 | #35 | Exceptional $109,185 |
| Latvians | 100.0 /100 | #36 | Exceptional $108,926 |
| Immigrants | Russia | 100.0 /100 | #37 | Exceptional $108,751 |
| Soviet Union | 100.0 /100 | #38 | Exceptional $108,457 |
| Immigrants | France | 99.9 /100 | #39 | Exceptional $108,257 |
| Immigrants | Lithuania | 99.9 /100 | #40 | Exceptional $108,149 |
| Immigrants | Bolivia | 99.9 /100 | #41 | Exceptional $108,128 |
Demographics Similar to Slovaks by Householder Income Ages 25 - 44 years
In terms of householder income ages 25 - 44 years, the demographic groups most similar to Slovaks are Alsatian ($95,059, a difference of 0.030%), Native Hawaiian ($95,058, a difference of 0.030%), Czechoslovakian ($95,070, a difference of 0.040%), Immigrants from Armenia ($94,867, a difference of 0.17%), and Immigrants from Ethiopia ($95,256, a difference of 0.23%).
| Demographics | Rating | Rank | Householder Income Ages 25 - 44 years |
| Immigrants | Saudi Arabia | 62.0 /100 | #163 | Good $95,450 |
| South Americans | 60.9 /100 | #164 | Good $95,362 |
| Immigrants | Nepal | 60.3 /100 | #165 | Good $95,322 |
| Immigrants | Ethiopia | 59.5 /100 | #166 | Average $95,256 |
| Czechoslovakians | 57.0 /100 | #167 | Average $95,070 |
| Alsatians | 56.8 /100 | #168 | Average $95,059 |
| Native Hawaiians | 56.8 /100 | #169 | Average $95,058 |
| Slovaks | 56.4 /100 | #170 | Average $95,032 |
| Immigrants | Armenia | 54.2 /100 | #171 | Average $94,867 |
| Scottish | 50.8 /100 | #172 | Average $94,622 |
| Finns | 50.6 /100 | #173 | Average $94,610 |
| Colombians | 50.0 /100 | #174 | Average $94,565 |
| English | 48.1 /100 | #175 | Average $94,429 |
| Immigrants | Immigrants | 48.0 /100 | #176 | Average $94,423 |
| Belgians | 45.8 /100 | #177 | Average $94,262 |