Bulgarian vs Immigrants from Venezuela Median Family Income
COMPARE
Bulgarian
Immigrants from Venezuela
Median Family Income
Median Family Income Comparison
Bulgarians
Immigrants from Venezuela
$117,818
MEDIAN FAMILY INCOME
100.0/ 100
METRIC RATING
43rd/ 347
METRIC RANK
$94,904
MEDIAN FAMILY INCOME
1.9/ 100
METRIC RATING
232nd/ 347
METRIC RANK
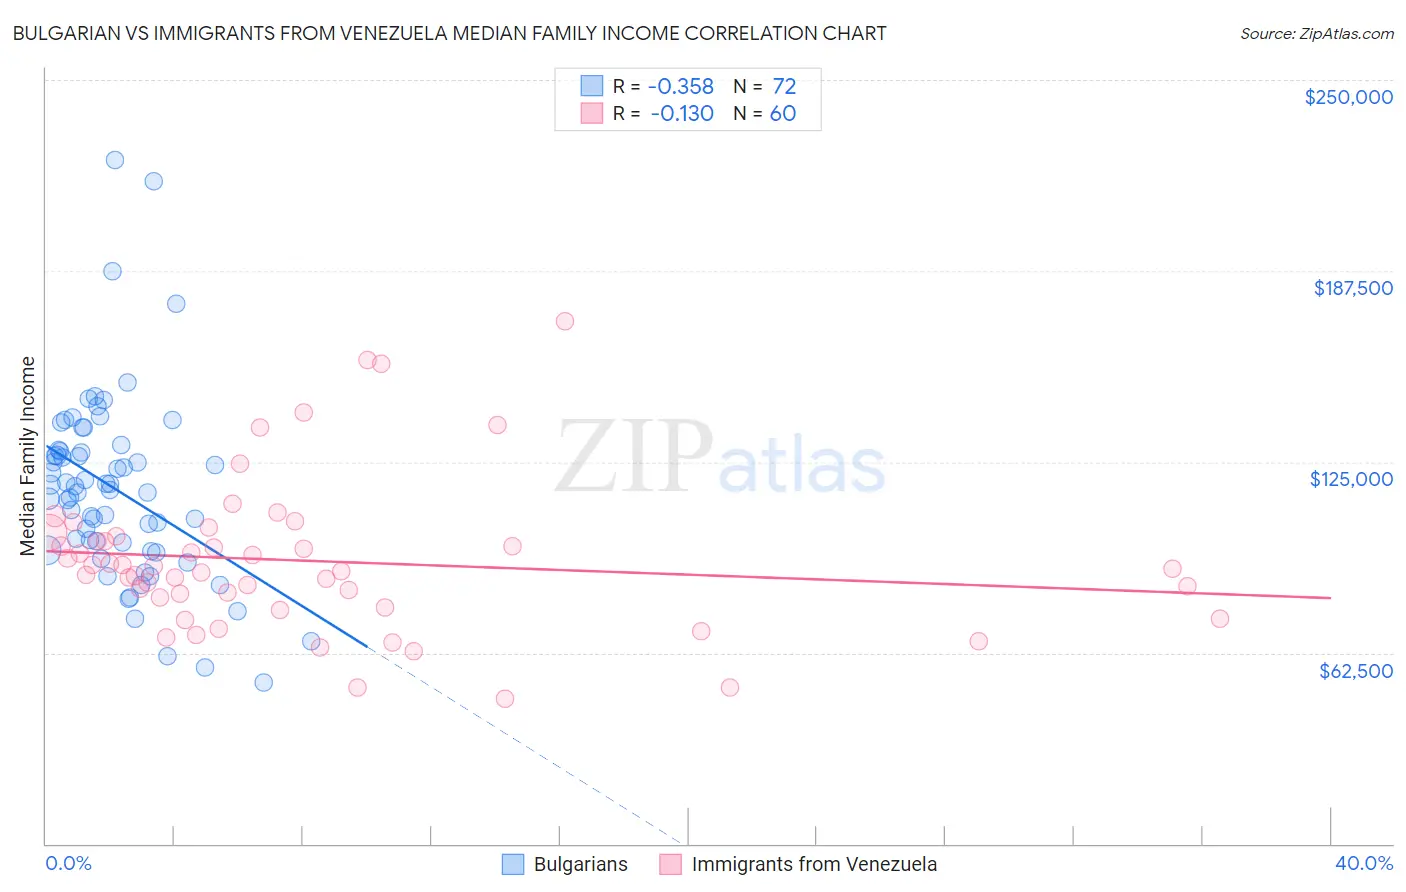
Bulgarian vs Immigrants from Venezuela Median Family Income Correlation Chart
The statistical analysis conducted on geographies consisting of 205,529,266 people shows a mild negative correlation between the proportion of Bulgarians and median family income in the United States with a correlation coefficient (R) of -0.358 and weighted average of $117,818. Similarly, the statistical analysis conducted on geographies consisting of 287,745,921 people shows a poor negative correlation between the proportion of Immigrants from Venezuela and median family income in the United States with a correlation coefficient (R) of -0.130 and weighted average of $94,904, a difference of 24.1%.
Median Family Income Correlation Summary
| Measurement | Bulgarian | Immigrants from Venezuela |
| Minimum | $52,778 | $47,465 |
| Maximum | $223,917 | $170,845 |
| Range | $171,139 | $123,380 |
| Mean | $116,110 | $92,607 |
| Median | $116,274 | $89,644 |
| Interquartile 25% (IQ1) | $97,368 | $78,947 |
| Interquartile 75% (IQ3) | $128,713 | $99,865 |
| Interquartile Range (IQR) | $31,345 | $20,918 |
| Standard Deviation (Sample) | $30,846 | $24,843 |
| Standard Deviation (Population) | $30,631 | $24,635 |
Similar Demographics by Median Family Income
Demographics Similar to Bulgarians by Median Family Income
In terms of median family income, the demographic groups most similar to Bulgarians are Cambodian ($117,780, a difference of 0.030%), Immigrants from Bolivia ($117,912, a difference of 0.080%), Estonian ($118,013, a difference of 0.17%), Immigrants from Lithuania ($118,053, a difference of 0.20%), and Immigrants from Asia ($118,291, a difference of 0.40%).
| Demographics | Rating | Rank | Median Family Income |
| Israelis | 100.0 /100 | #36 | Exceptional $118,577 |
| Australians | 100.0 /100 | #37 | Exceptional $118,440 |
| Immigrants | Turkey | 100.0 /100 | #38 | Exceptional $118,325 |
| Immigrants | Asia | 100.0 /100 | #39 | Exceptional $118,291 |
| Immigrants | Lithuania | 100.0 /100 | #40 | Exceptional $118,053 |
| Estonians | 100.0 /100 | #41 | Exceptional $118,013 |
| Immigrants | Bolivia | 100.0 /100 | #42 | Exceptional $117,912 |
| Bulgarians | 100.0 /100 | #43 | Exceptional $117,818 |
| Cambodians | 100.0 /100 | #44 | Exceptional $117,780 |
| Immigrants | Greece | 99.9 /100 | #45 | Exceptional $117,344 |
| Immigrants | Russia | 99.9 /100 | #46 | Exceptional $116,942 |
| Immigrants | Austria | 99.9 /100 | #47 | Exceptional $116,830 |
| Immigrants | South Africa | 99.9 /100 | #48 | Exceptional $116,286 |
| Chinese | 99.9 /100 | #49 | Exceptional $116,188 |
| Immigrants | Czechoslovakia | 99.9 /100 | #50 | Exceptional $116,165 |
Demographics Similar to Immigrants from Venezuela by Median Family Income
In terms of median family income, the demographic groups most similar to Immigrants from Venezuela are Ecuadorian ($95,114, a difference of 0.22%), Immigrants from Bangladesh ($94,665, a difference of 0.25%), Immigrants from Western Africa ($94,638, a difference of 0.28%), Malaysian ($95,230, a difference of 0.34%), and Marshallese ($95,293, a difference of 0.41%).
| Demographics | Rating | Rank | Median Family Income |
| Vietnamese | 3.4 /100 | #225 | Tragic $96,123 |
| Immigrants | Panama | 2.7 /100 | #226 | Tragic $95,647 |
| Alaska Natives | 2.6 /100 | #227 | Tragic $95,573 |
| Immigrants | Azores | 2.4 /100 | #228 | Tragic $95,402 |
| Marshallese | 2.2 /100 | #229 | Tragic $95,293 |
| Malaysians | 2.2 /100 | #230 | Tragic $95,230 |
| Ecuadorians | 2.1 /100 | #231 | Tragic $95,114 |
| Immigrants | Venezuela | 1.9 /100 | #232 | Tragic $94,904 |
| Immigrants | Bangladesh | 1.6 /100 | #233 | Tragic $94,665 |
| Immigrants | Western Africa | 1.6 /100 | #234 | Tragic $94,638 |
| Immigrants | Burma/Myanmar | 1.5 /100 | #235 | Tragic $94,472 |
| Trinidadians and Tobagonians | 1.5 /100 | #236 | Tragic $94,466 |
| Alaskan Athabascans | 1.5 /100 | #237 | Tragic $94,429 |
| Nepalese | 1.3 /100 | #238 | Tragic $94,153 |
| Salvadorans | 1.2 /100 | #239 | Tragic $94,109 |