Cambodian vs Pima Median Family Income
COMPARE
Cambodian
Pima
Median Family Income
Median Family Income Comparison
Cambodians
Pima
$117,780
MEDIAN FAMILY INCOME
100.0/ 100
METRIC RATING
44th/ 347
METRIC RANK
$77,431
MEDIAN FAMILY INCOME
0.0/ 100
METRIC RATING
339th/ 347
METRIC RANK
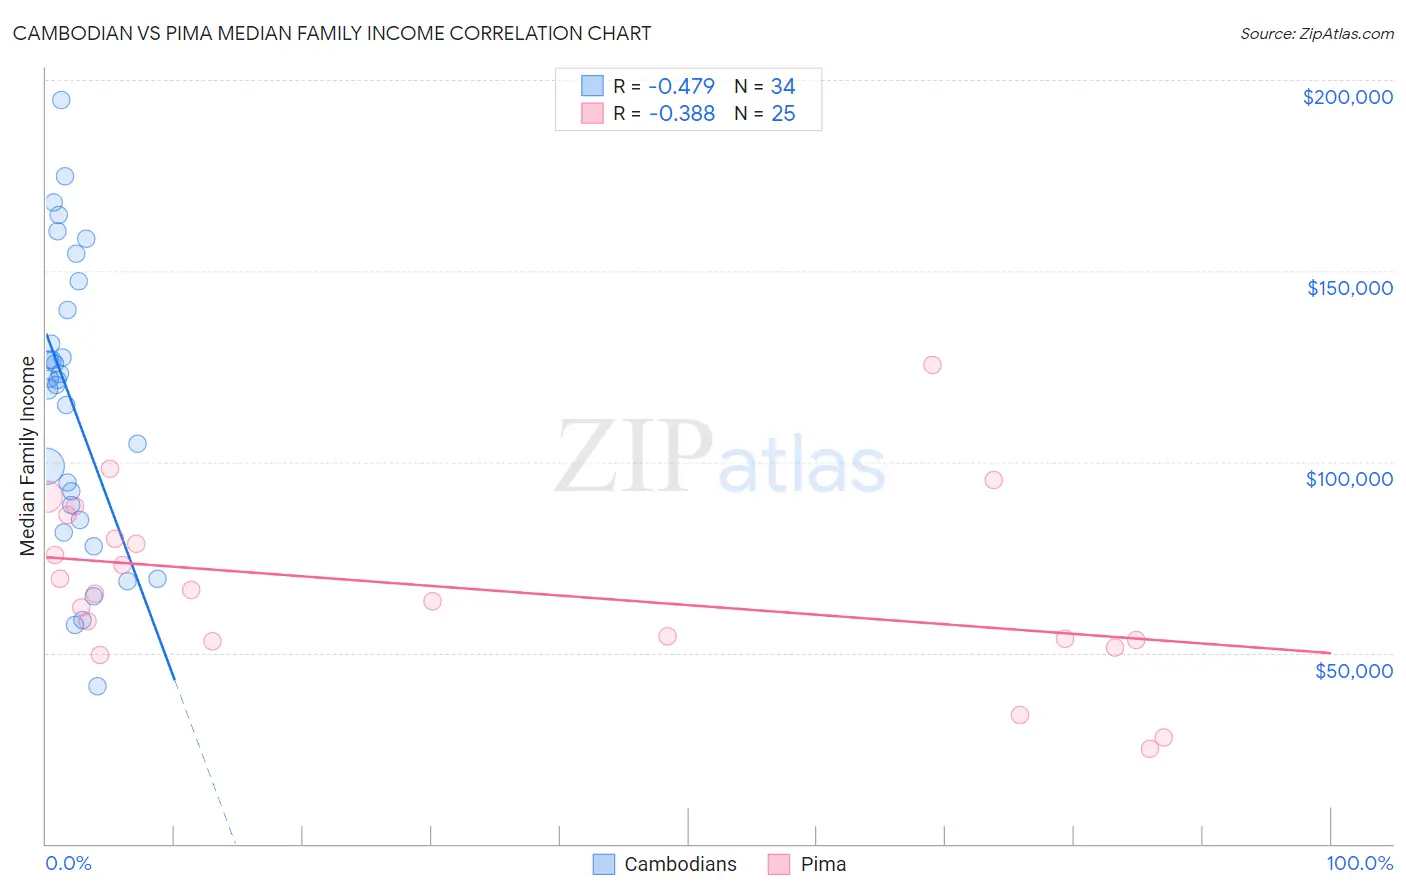
Cambodian vs Pima Median Family Income Correlation Chart
The statistical analysis conducted on geographies consisting of 102,461,045 people shows a moderate negative correlation between the proportion of Cambodians and median family income in the United States with a correlation coefficient (R) of -0.479 and weighted average of $117,780. Similarly, the statistical analysis conducted on geographies consisting of 61,529,758 people shows a mild negative correlation between the proportion of Pima and median family income in the United States with a correlation coefficient (R) of -0.388 and weighted average of $77,431, a difference of 52.1%.
Median Family Income Correlation Summary
| Measurement | Cambodian | Pima |
| Minimum | $41,250 | $24,821 |
| Maximum | $194,752 | $125,278 |
| Range | $153,502 | $100,457 |
| Mean | $114,811 | $67,157 |
| Median | $120,749 | $65,417 |
| Interquartile 25% (IQ1) | $84,853 | $53,298 |
| Interquartile 75% (IQ3) | $139,722 | $83,045 |
| Interquartile Range (IQR) | $54,869 | $29,747 |
| Standard Deviation (Sample) | $37,903 | $23,070 |
| Standard Deviation (Population) | $37,342 | $22,604 |
Similar Demographics by Median Family Income
Demographics Similar to Cambodians by Median Family Income
In terms of median family income, the demographic groups most similar to Cambodians are Bulgarian ($117,818, a difference of 0.030%), Immigrants from Bolivia ($117,912, a difference of 0.11%), Estonian ($118,013, a difference of 0.20%), Immigrants from Lithuania ($118,053, a difference of 0.23%), and Immigrants from Greece ($117,344, a difference of 0.37%).
| Demographics | Rating | Rank | Median Family Income |
| Australians | 100.0 /100 | #37 | Exceptional $118,440 |
| Immigrants | Turkey | 100.0 /100 | #38 | Exceptional $118,325 |
| Immigrants | Asia | 100.0 /100 | #39 | Exceptional $118,291 |
| Immigrants | Lithuania | 100.0 /100 | #40 | Exceptional $118,053 |
| Estonians | 100.0 /100 | #41 | Exceptional $118,013 |
| Immigrants | Bolivia | 100.0 /100 | #42 | Exceptional $117,912 |
| Bulgarians | 100.0 /100 | #43 | Exceptional $117,818 |
| Cambodians | 100.0 /100 | #44 | Exceptional $117,780 |
| Immigrants | Greece | 99.9 /100 | #45 | Exceptional $117,344 |
| Immigrants | Russia | 99.9 /100 | #46 | Exceptional $116,942 |
| Immigrants | Austria | 99.9 /100 | #47 | Exceptional $116,830 |
| Immigrants | South Africa | 99.9 /100 | #48 | Exceptional $116,286 |
| Chinese | 99.9 /100 | #49 | Exceptional $116,188 |
| Immigrants | Czechoslovakia | 99.9 /100 | #50 | Exceptional $116,165 |
| Immigrants | Malaysia | 99.9 /100 | #51 | Exceptional $115,880 |
Demographics Similar to Pima by Median Family Income
In terms of median family income, the demographic groups most similar to Pima are Immigrants from Yemen ($77,457, a difference of 0.030%), Hopi ($77,188, a difference of 0.32%), Pueblo ($76,880, a difference of 0.72%), Yuman ($78,055, a difference of 0.80%), and Immigrants from Cuba ($78,249, a difference of 1.1%).
| Demographics | Rating | Rank | Median Family Income |
| Natives/Alaskans | 0.0 /100 | #332 | Tragic $80,908 |
| Kiowa | 0.0 /100 | #333 | Tragic $80,885 |
| Menominee | 0.0 /100 | #334 | Tragic $79,563 |
| Yup'ik | 0.0 /100 | #335 | Tragic $79,290 |
| Immigrants | Cuba | 0.0 /100 | #336 | Tragic $78,249 |
| Yuman | 0.0 /100 | #337 | Tragic $78,055 |
| Immigrants | Yemen | 0.0 /100 | #338 | Tragic $77,457 |
| Pima | 0.0 /100 | #339 | Tragic $77,431 |
| Hopi | 0.0 /100 | #340 | Tragic $77,188 |
| Pueblo | 0.0 /100 | #341 | Tragic $76,880 |
| Crow | 0.0 /100 | #342 | Tragic $76,605 |
| Houma | 0.0 /100 | #343 | Tragic $76,188 |
| Tohono O'odham | 0.0 /100 | #344 | Tragic $72,193 |
| Navajo | 0.0 /100 | #345 | Tragic $70,989 |
| Puerto Ricans | 0.0 /100 | #346 | Tragic $70,423 |