Cambodian vs Yugoslavian Householder Income Ages 45 - 64 years
COMPARE
Cambodian
Yugoslavian
Householder Income Ages 45 - 64 years
Householder Income Ages 45 - 64 years Comparison
Cambodians
Yugoslavians
$114,342
HOUSEHOLDER INCOME AGES 45 - 64 YEARS
99.9/ 100
METRIC RATING
40th/ 347
METRIC RANK
$97,558
HOUSEHOLDER INCOME AGES 45 - 64 YEARS
20.0/ 100
METRIC RATING
201st/ 347
METRIC RANK
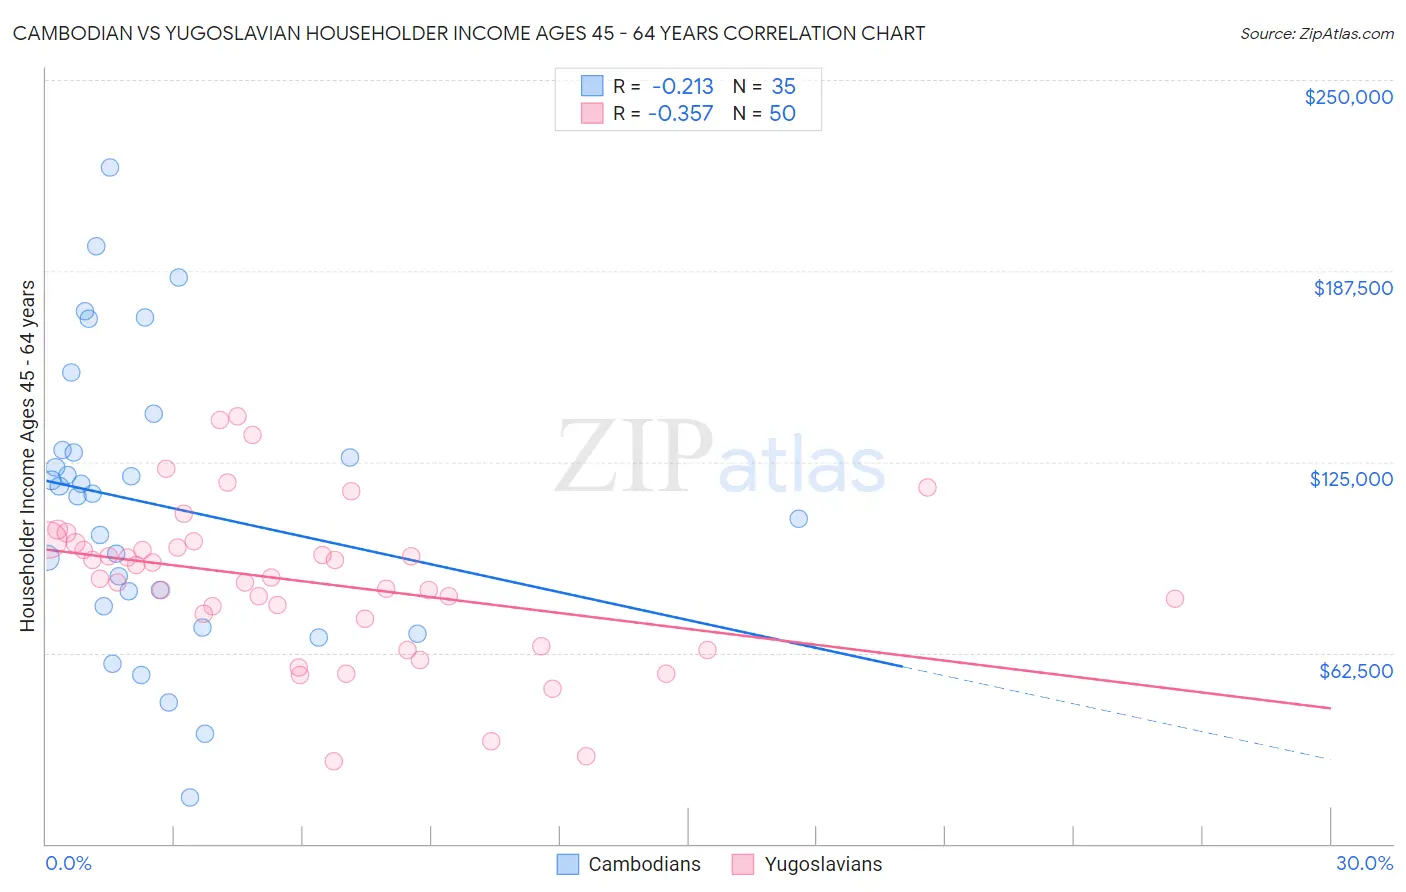
Cambodian vs Yugoslavian Householder Income Ages 45 - 64 years Correlation Chart
The statistical analysis conducted on geographies consisting of 102,430,914 people shows a weak negative correlation between the proportion of Cambodians and household income with householder between the ages 45 and 64 in the United States with a correlation coefficient (R) of -0.213 and weighted average of $114,342. Similarly, the statistical analysis conducted on geographies consisting of 285,465,008 people shows a mild negative correlation between the proportion of Yugoslavians and household income with householder between the ages 45 and 64 in the United States with a correlation coefficient (R) of -0.357 and weighted average of $97,558, a difference of 17.2%.
Householder Income Ages 45 - 64 years Correlation Summary
| Measurement | Cambodian | Yugoslavian |
| Minimum | $15,079 | $26,989 |
| Maximum | $221,500 | $140,097 |
| Range | $206,421 | $113,108 |
| Mean | $111,198 | $85,735 |
| Median | $114,622 | $86,945 |
| Interquartile 25% (IQ1) | $77,671 | $73,466 |
| Interquartile 75% (IQ3) | $128,994 | $98,460 |
| Interquartile Range (IQR) | $51,323 | $24,994 |
| Standard Deviation (Sample) | $46,823 | $25,335 |
| Standard Deviation (Population) | $46,149 | $25,080 |
Similar Demographics by Householder Income Ages 45 - 64 years
Demographics Similar to Cambodians by Householder Income Ages 45 - 64 years
In terms of householder income ages 45 - 64 years, the demographic groups most similar to Cambodians are Immigrants from Lithuania ($114,336, a difference of 0.010%), Immigrants from Turkey ($114,407, a difference of 0.060%), Immigrants from Pakistan ($114,434, a difference of 0.080%), Estonian ($114,220, a difference of 0.11%), and Israeli ($114,186, a difference of 0.14%).
| Demographics | Rating | Rank | Householder Income Ages 45 - 64 years |
| Chinese | 100.0 /100 | #33 | Exceptional $116,156 |
| Immigrants | Denmark | 100.0 /100 | #34 | Exceptional $116,000 |
| Latvians | 100.0 /100 | #35 | Exceptional $115,957 |
| Immigrants | Switzerland | 100.0 /100 | #36 | Exceptional $115,934 |
| Maltese | 99.9 /100 | #37 | Exceptional $114,754 |
| Immigrants | Pakistan | 99.9 /100 | #38 | Exceptional $114,434 |
| Immigrants | Turkey | 99.9 /100 | #39 | Exceptional $114,407 |
| Cambodians | 99.9 /100 | #40 | Exceptional $114,342 |
| Immigrants | Lithuania | 99.9 /100 | #41 | Exceptional $114,336 |
| Estonians | 99.9 /100 | #42 | Exceptional $114,220 |
| Israelis | 99.9 /100 | #43 | Exceptional $114,186 |
| Bulgarians | 99.9 /100 | #44 | Exceptional $113,883 |
| Immigrants | France | 99.9 /100 | #45 | Exceptional $113,680 |
| Immigrants | Greece | 99.9 /100 | #46 | Exceptional $113,548 |
| Australians | 99.9 /100 | #47 | Exceptional $113,533 |
Demographics Similar to Yugoslavians by Householder Income Ages 45 - 64 years
In terms of householder income ages 45 - 64 years, the demographic groups most similar to Yugoslavians are Tlingit-Haida ($97,417, a difference of 0.15%), Immigrants from Thailand ($97,400, a difference of 0.16%), Immigrants from Eritrea ($97,373, a difference of 0.19%), Immigrants from Colombia ($97,290, a difference of 0.28%), and Immigrants from Africa ($97,284, a difference of 0.28%).
| Demographics | Rating | Rank | Householder Income Ages 45 - 64 years |
| Uruguayans | 30.3 /100 | #194 | Fair $98,660 |
| Spanish | 29.2 /100 | #195 | Fair $98,554 |
| Immigrants | Eastern Africa | 28.3 /100 | #196 | Fair $98,467 |
| Puget Sound Salish | 27.0 /100 | #197 | Fair $98,340 |
| Immigrants | Iraq | 25.7 /100 | #198 | Fair $98,201 |
| Whites/Caucasians | 24.6 /100 | #199 | Fair $98,091 |
| Immigrants | Kenya | 23.5 /100 | #200 | Fair $97,964 |
| Yugoslavians | 20.0 /100 | #201 | Fair $97,558 |
| Tlingit-Haida | 18.9 /100 | #202 | Poor $97,417 |
| Immigrants | Thailand | 18.8 /100 | #203 | Poor $97,400 |
| Immigrants | Eritrea | 18.6 /100 | #204 | Poor $97,373 |
| Immigrants | Colombia | 18.0 /100 | #205 | Poor $97,290 |
| Immigrants | Africa | 17.9 /100 | #206 | Poor $97,284 |
| Ghanaians | 17.9 /100 | #207 | Poor $97,277 |
| Scotch-Irish | 16.4 /100 | #208 | Poor $97,073 |