Celtic vs Scotch-Irish Householder Income Under 25 years
COMPARE
Celtic
Scotch-Irish
Householder Income Under 25 years
Householder Income Under 25 years Comparison
Celtics
Scotch-Irish
$50,447
HOUSEHOLDER INCOME UNDER 25 YEARS
1.4/ 100
METRIC RATING
251st/ 347
METRIC RANK
$49,039
HOUSEHOLDER INCOME UNDER 25 YEARS
0.0/ 100
METRIC RATING
285th/ 347
METRIC RANK
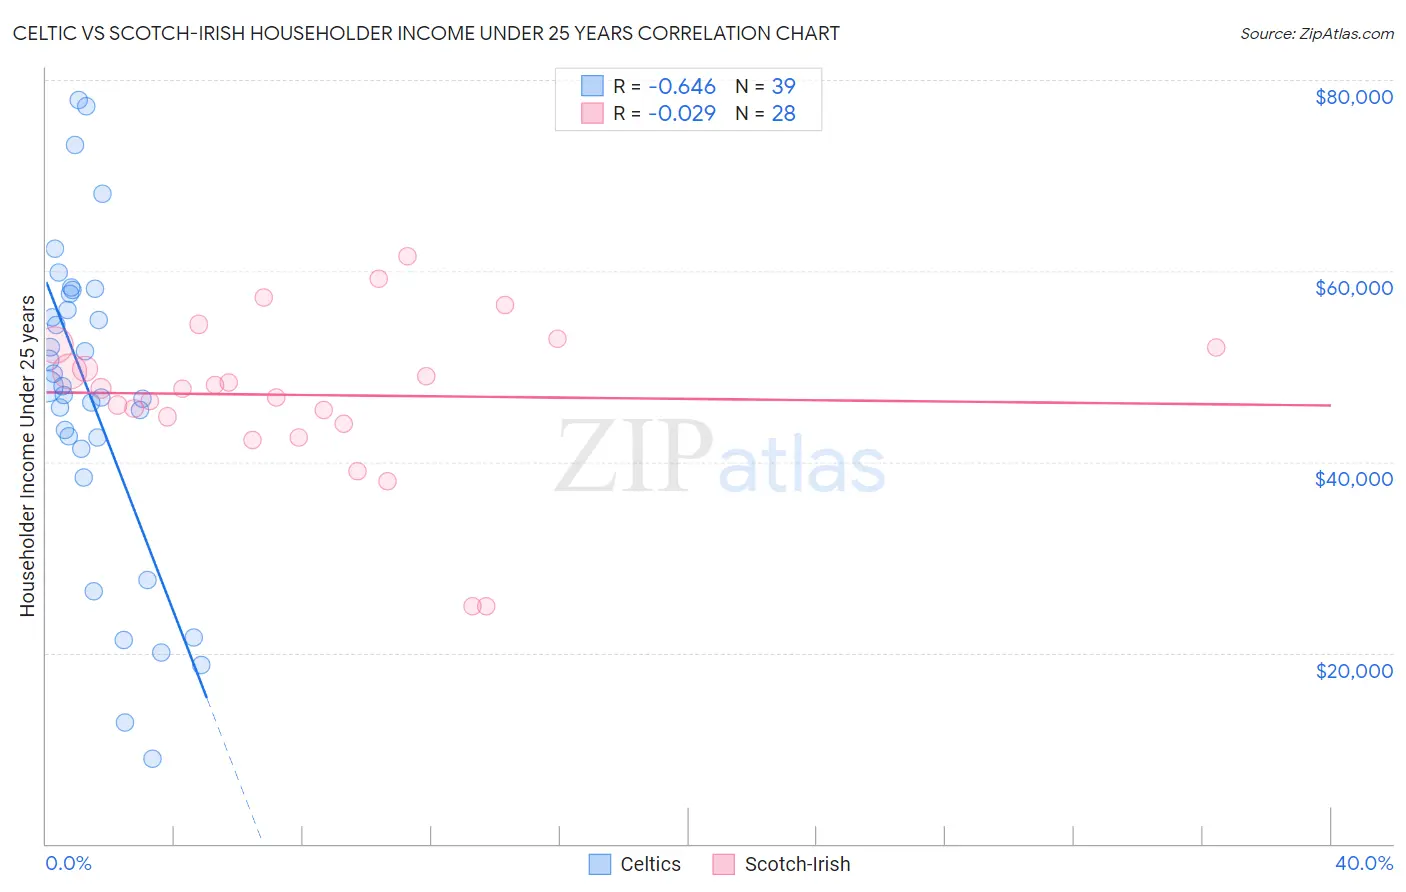
Celtic vs Scotch-Irish Householder Income Under 25 years Correlation Chart
The statistical analysis conducted on geographies consisting of 153,501,532 people shows a significant negative correlation between the proportion of Celtics and household income with householder under the age of 25 in the United States with a correlation coefficient (R) of -0.646 and weighted average of $50,447. Similarly, the statistical analysis conducted on geographies consisting of 427,674,236 people shows no correlation between the proportion of Scotch-Irish and household income with householder under the age of 25 in the United States with a correlation coefficient (R) of -0.029 and weighted average of $49,039, a difference of 2.9%.
Householder Income Under 25 years Correlation Summary
| Measurement | Celtic | Scotch-Irish |
| Minimum | $8,850 | $24,821 |
| Maximum | $77,857 | $61,601 |
| Range | $69,007 | $36,780 |
| Mean | $46,502 | $47,004 |
| Median | $47,888 | $47,645 |
| Interquartile 25% (IQ1) | $41,319 | $44,331 |
| Interquartile 75% (IQ3) | $57,577 | $52,103 |
| Interquartile Range (IQR) | $16,258 | $7,772 |
| Standard Deviation (Sample) | $16,722 | $8,411 |
| Standard Deviation (Population) | $16,506 | $8,259 |
Similar Demographics by Householder Income Under 25 years
Demographics Similar to Celtics by Householder Income Under 25 years
In terms of householder income under 25 years, the demographic groups most similar to Celtics are Immigrants from Mexico ($50,422, a difference of 0.050%), Immigrants from Haiti ($50,398, a difference of 0.10%), Luxembourger ($50,379, a difference of 0.13%), Immigrants from Cabo Verde ($50,520, a difference of 0.14%), and Aleut ($50,377, a difference of 0.14%).
| Demographics | Rating | Rank | Householder Income Under 25 years |
| Marshallese | 2.1 /100 | #244 | Tragic $50,627 |
| Immigrants | Africa | 2.0 /100 | #245 | Tragic $50,609 |
| Welsh | 2.0 /100 | #246 | Tragic $50,597 |
| Immigrants | Bosnia and Herzegovina | 1.8 /100 | #247 | Tragic $50,565 |
| Slavs | 1.8 /100 | #248 | Tragic $50,563 |
| Scottish | 1.8 /100 | #249 | Tragic $50,554 |
| Immigrants | Cabo Verde | 1.7 /100 | #250 | Tragic $50,520 |
| Celtics | 1.4 /100 | #251 | Tragic $50,447 |
| Immigrants | Mexico | 1.3 /100 | #252 | Tragic $50,422 |
| Immigrants | Haiti | 1.2 /100 | #253 | Tragic $50,398 |
| Luxembourgers | 1.2 /100 | #254 | Tragic $50,379 |
| Aleuts | 1.2 /100 | #255 | Tragic $50,377 |
| Immigrants | Cuba | 1.2 /100 | #256 | Tragic $50,374 |
| Lebanese | 1.1 /100 | #257 | Tragic $50,355 |
| Whites/Caucasians | 1.1 /100 | #258 | Tragic $50,336 |
Demographics Similar to Scotch-Irish by Householder Income Under 25 years
In terms of householder income under 25 years, the demographic groups most similar to Scotch-Irish are French American Indian ($48,977, a difference of 0.13%), Carpatho Rusyn ($49,113, a difference of 0.15%), Senegalese ($48,953, a difference of 0.18%), Liberian ($48,917, a difference of 0.25%), and Immigrants from Nigeria ($49,174, a difference of 0.28%).
| Demographics | Rating | Rank | Householder Income Under 25 years |
| Nigerians | 0.1 /100 | #278 | Tragic $49,416 |
| Apache | 0.1 /100 | #279 | Tragic $49,395 |
| Hmong | 0.1 /100 | #280 | Tragic $49,364 |
| Immigrants | Nonimmigrants | 0.1 /100 | #281 | Tragic $49,348 |
| Alsatians | 0.1 /100 | #282 | Tragic $49,267 |
| Immigrants | Nigeria | 0.1 /100 | #283 | Tragic $49,174 |
| Carpatho Rusyns | 0.1 /100 | #284 | Tragic $49,113 |
| Scotch-Irish | 0.0 /100 | #285 | Tragic $49,039 |
| French American Indians | 0.0 /100 | #286 | Tragic $48,977 |
| Senegalese | 0.0 /100 | #287 | Tragic $48,953 |
| Liberians | 0.0 /100 | #288 | Tragic $48,917 |
| Hondurans | 0.0 /100 | #289 | Tragic $48,885 |
| Americans | 0.0 /100 | #290 | Tragic $48,860 |
| Immigrants | Burma/Myanmar | 0.0 /100 | #291 | Tragic $48,749 |
| Shoshone | 0.0 /100 | #292 | Tragic $48,720 |