Czech vs Spanish American Median Household Income
COMPARE
Czech
Spanish American
Median Household Income
Median Household Income Comparison
Czechs
Spanish Americans
$86,164
MEDIAN HOUSEHOLD INCOME
66.4/ 100
METRIC RATING
163rd/ 347
METRIC RANK
$75,386
MEDIAN HOUSEHOLD INCOME
0.2/ 100
METRIC RATING
277th/ 347
METRIC RANK
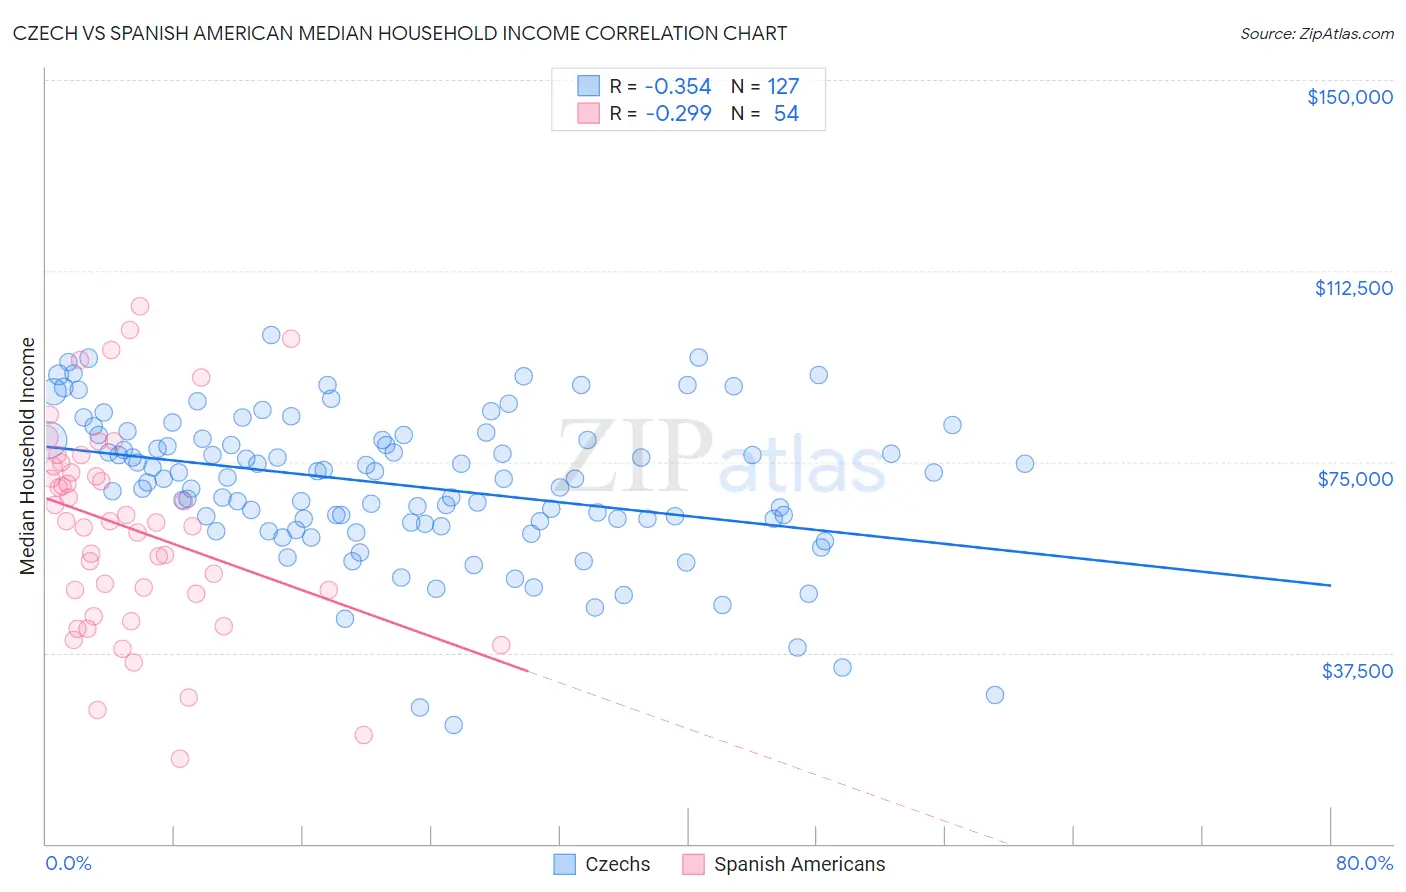
Czech vs Spanish American Median Household Income Correlation Chart
The statistical analysis conducted on geographies consisting of 484,294,688 people shows a mild negative correlation between the proportion of Czechs and median household income in the United States with a correlation coefficient (R) of -0.354 and weighted average of $86,164. Similarly, the statistical analysis conducted on geographies consisting of 103,163,457 people shows a weak negative correlation between the proportion of Spanish Americans and median household income in the United States with a correlation coefficient (R) of -0.299 and weighted average of $75,386, a difference of 14.3%.
Median Household Income Correlation Summary
| Measurement | Czech | Spanish American |
| Minimum | $23,393 | $16,806 |
| Maximum | $99,887 | $105,648 |
| Range | $76,494 | $88,842 |
| Mean | $70,465 | $61,918 |
| Median | $71,750 | $63,227 |
| Interquartile 25% (IQ1) | $63,125 | $49,158 |
| Interquartile 75% (IQ3) | $79,521 | $74,166 |
| Interquartile Range (IQR) | $16,396 | $25,008 |
| Standard Deviation (Sample) | $14,479 | $20,311 |
| Standard Deviation (Population) | $14,422 | $20,122 |
Similar Demographics by Median Household Income
Demographics Similar to Czechs by Median Household Income
In terms of median household income, the demographic groups most similar to Czechs are Irish ($86,145, a difference of 0.020%), Norwegian ($86,084, a difference of 0.090%), Guamanian/Chamorro ($86,255, a difference of 0.11%), Scandinavian ($86,073, a difference of 0.11%), and Slavic ($86,398, a difference of 0.27%).
| Demographics | Rating | Rank | Median Household Income |
| Immigrants | Albania | 71.5 /100 | #156 | Good $86,534 |
| Samoans | 71.0 /100 | #157 | Good $86,498 |
| Moroccans | 70.6 /100 | #158 | Good $86,468 |
| Immigrants | Uzbekistan | 70.1 /100 | #159 | Good $86,425 |
| Luxembourgers | 70.0 /100 | #160 | Good $86,418 |
| Slavs | 69.7 /100 | #161 | Good $86,398 |
| Guamanians/Chamorros | 67.7 /100 | #162 | Good $86,255 |
| Czechs | 66.4 /100 | #163 | Good $86,164 |
| Irish | 66.2 /100 | #164 | Good $86,145 |
| Norwegians | 65.3 /100 | #165 | Good $86,084 |
| Scandinavians | 65.1 /100 | #166 | Good $86,073 |
| Immigrants | Immigrants | 61.3 /100 | #167 | Good $85,818 |
| Icelanders | 61.0 /100 | #168 | Good $85,797 |
| Colombians | 59.7 /100 | #169 | Average $85,716 |
| Swiss | 59.2 /100 | #170 | Average $85,681 |
Demographics Similar to Spanish Americans by Median Household Income
In terms of median household income, the demographic groups most similar to Spanish Americans are Immigrants from Latin America ($75,420, a difference of 0.040%), Osage ($75,240, a difference of 0.19%), Immigrants from Micronesia ($75,574, a difference of 0.25%), British West Indian ($75,647, a difference of 0.35%), and Immigrants from Guatemala ($75,123, a difference of 0.35%).
| Demographics | Rating | Rank | Median Household Income |
| Hmong | 0.3 /100 | #270 | Tragic $75,839 |
| Pennsylvania Germans | 0.3 /100 | #271 | Tragic $75,814 |
| Somalis | 0.3 /100 | #272 | Tragic $75,782 |
| Liberians | 0.2 /100 | #273 | Tragic $75,667 |
| British West Indians | 0.2 /100 | #274 | Tragic $75,647 |
| Immigrants | Micronesia | 0.2 /100 | #275 | Tragic $75,574 |
| Immigrants | Latin America | 0.2 /100 | #276 | Tragic $75,420 |
| Spanish Americans | 0.2 /100 | #277 | Tragic $75,386 |
| Osage | 0.2 /100 | #278 | Tragic $75,240 |
| Immigrants | Guatemala | 0.2 /100 | #279 | Tragic $75,123 |
| Senegalese | 0.2 /100 | #280 | Tragic $74,999 |
| Immigrants | Liberia | 0.1 /100 | #281 | Tragic $74,896 |
| Central American Indians | 0.1 /100 | #282 | Tragic $74,847 |
| Cree | 0.1 /100 | #283 | Tragic $74,685 |
| Yaqui | 0.1 /100 | #284 | Tragic $74,596 |