Dutch vs Colville Median Earnings
COMPARE
Dutch
Colville
Median Earnings
Median Earnings Comparison
Dutch
Colville
$45,370
MEDIAN EARNINGS
18.4/ 100
METRIC RATING
219th/ 347
METRIC RANK
$42,151
MEDIAN EARNINGS
0.2/ 100
METRIC RATING
279th/ 347
METRIC RANK
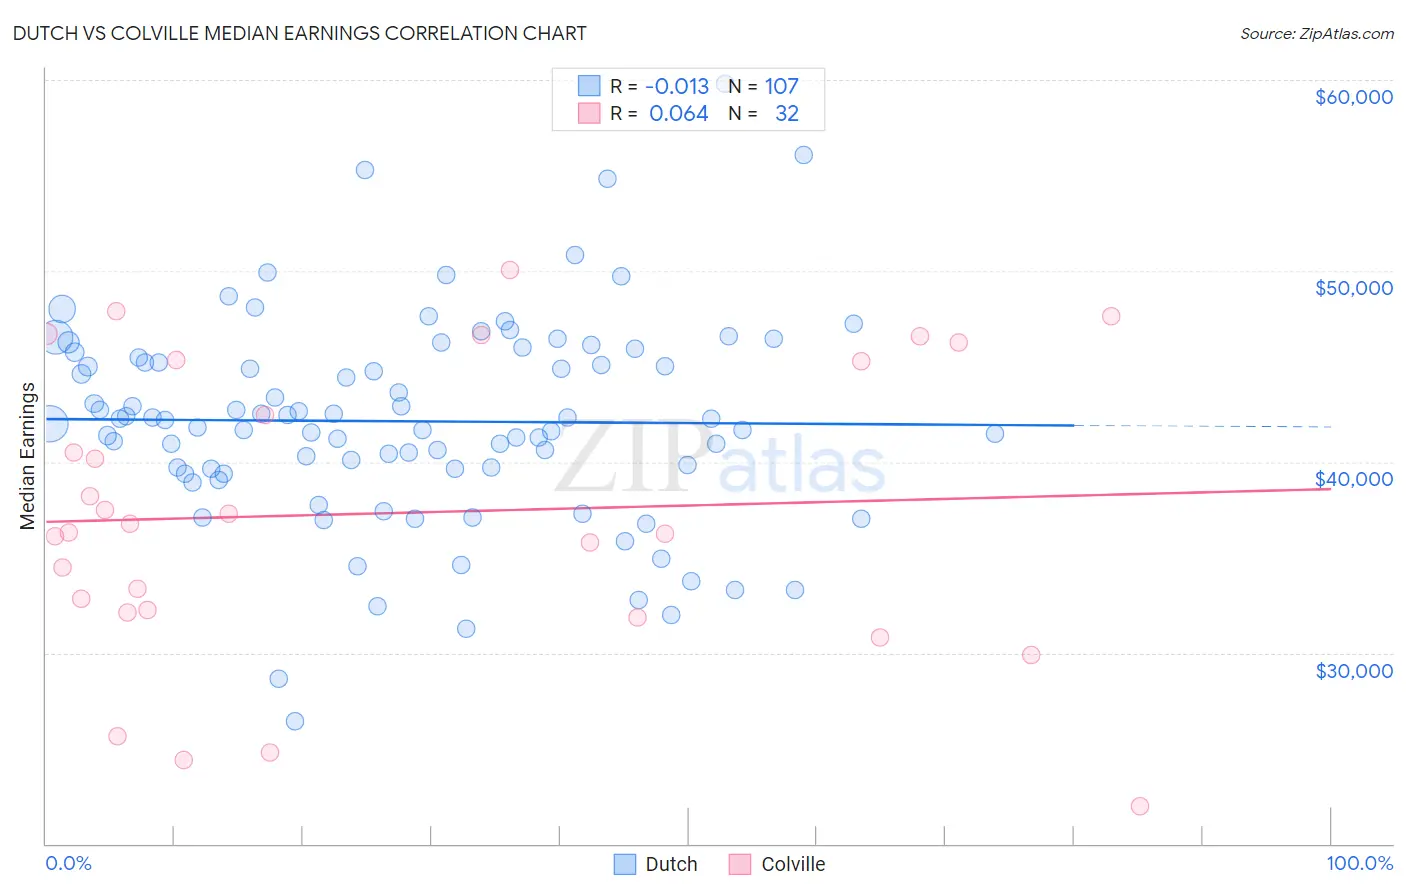
Dutch vs Colville Median Earnings Correlation Chart
The statistical analysis conducted on geographies consisting of 554,077,686 people shows no correlation between the proportion of Dutch and median earnings in the United States with a correlation coefficient (R) of -0.013 and weighted average of $45,370. Similarly, the statistical analysis conducted on geographies consisting of 34,684,676 people shows a slight positive correlation between the proportion of Colville and median earnings in the United States with a correlation coefficient (R) of 0.064 and weighted average of $42,151, a difference of 7.6%.
Median Earnings Correlation Summary
| Measurement | Dutch | Colville |
| Minimum | $26,401 | $21,944 |
| Maximum | $59,776 | $50,045 |
| Range | $33,374 | $28,101 |
| Mean | $42,124 | $37,312 |
| Median | $42,201 | $36,531 |
| Interquartile 25% (IQ1) | $39,612 | $32,193 |
| Interquartile 75% (IQ3) | $45,450 | $45,323 |
| Interquartile Range (IQR) | $5,838 | $13,130 |
| Standard Deviation (Sample) | $5,476 | $7,666 |
| Standard Deviation (Population) | $5,450 | $7,545 |
Similar Demographics by Median Earnings
Demographics Similar to Dutch by Median Earnings
In terms of median earnings, the demographic groups most similar to Dutch are Spanish ($45,432, a difference of 0.14%), Guyanese ($45,470, a difference of 0.22%), Tlingit-Haida ($45,468, a difference of 0.22%), Ecuadorian ($45,214, a difference of 0.35%), and Nigerian ($45,532, a difference of 0.36%).
| Demographics | Rating | Rank | Median Earnings |
| Bermudans | 23.5 /100 | #212 | Fair $45,593 |
| Immigrants | Colombia | 22.4 /100 | #213 | Fair $45,550 |
| Nigerians | 22.0 /100 | #214 | Fair $45,532 |
| Immigrants | Bangladesh | 22.0 /100 | #215 | Fair $45,532 |
| Guyanese | 20.6 /100 | #216 | Fair $45,470 |
| Tlingit-Haida | 20.5 /100 | #217 | Fair $45,468 |
| Spanish | 19.7 /100 | #218 | Poor $45,432 |
| Dutch | 18.4 /100 | #219 | Poor $45,370 |
| Ecuadorians | 15.3 /100 | #220 | Poor $45,214 |
| Immigrants | Guyana | 15.1 /100 | #221 | Poor $45,204 |
| Immigrants | Panama | 15.0 /100 | #222 | Poor $45,198 |
| Whites/Caucasians | 15.0 /100 | #223 | Poor $45,197 |
| West Indians | 13.9 /100 | #224 | Poor $45,132 |
| Immigrants | Cambodia | 13.2 /100 | #225 | Poor $45,090 |
| Immigrants | Nigeria | 12.2 /100 | #226 | Poor $45,030 |
Demographics Similar to Colville by Median Earnings
In terms of median earnings, the demographic groups most similar to Colville are Cajun ($42,189, a difference of 0.090%), Hmong ($42,111, a difference of 0.10%), Central American ($42,280, a difference of 0.31%), Spanish American ($42,316, a difference of 0.39%), and Marshallese ($41,969, a difference of 0.43%).
| Demographics | Rating | Rank | Median Earnings |
| Iroquois | 0.4 /100 | #272 | Tragic $42,430 |
| Immigrants | Dominica | 0.4 /100 | #273 | Tragic $42,420 |
| Immigrants | El Salvador | 0.4 /100 | #274 | Tragic $42,413 |
| Immigrants | Belize | 0.3 /100 | #275 | Tragic $42,339 |
| Spanish Americans | 0.3 /100 | #276 | Tragic $42,316 |
| Central Americans | 0.3 /100 | #277 | Tragic $42,280 |
| Cajuns | 0.3 /100 | #278 | Tragic $42,189 |
| Colville | 0.2 /100 | #279 | Tragic $42,151 |
| Hmong | 0.2 /100 | #280 | Tragic $42,111 |
| Marshallese | 0.2 /100 | #281 | Tragic $41,969 |
| Africans | 0.2 /100 | #282 | Tragic $41,955 |
| Dominicans | 0.2 /100 | #283 | Tragic $41,864 |
| Blackfeet | 0.2 /100 | #284 | Tragic $41,822 |
| Immigrants | Nicaragua | 0.1 /100 | #285 | Tragic $41,737 |
| Mexican American Indians | 0.1 /100 | #286 | Tragic $41,719 |