Ecuadorian vs Immigrants from South Eastern Asia Householder Income Over 65 years
COMPARE
Ecuadorian
Immigrants from South Eastern Asia
Householder Income Over 65 years
Householder Income Over 65 years Comparison
Ecuadorians
Immigrants from South Eastern Asia
$54,958
HOUSEHOLDER INCOME OVER 65 YEARS
0.2/ 100
METRIC RATING
258th/ 347
METRIC RANK
$64,089
HOUSEHOLDER INCOME OVER 65 YEARS
96.3/ 100
METRIC RATING
100th/ 347
METRIC RANK
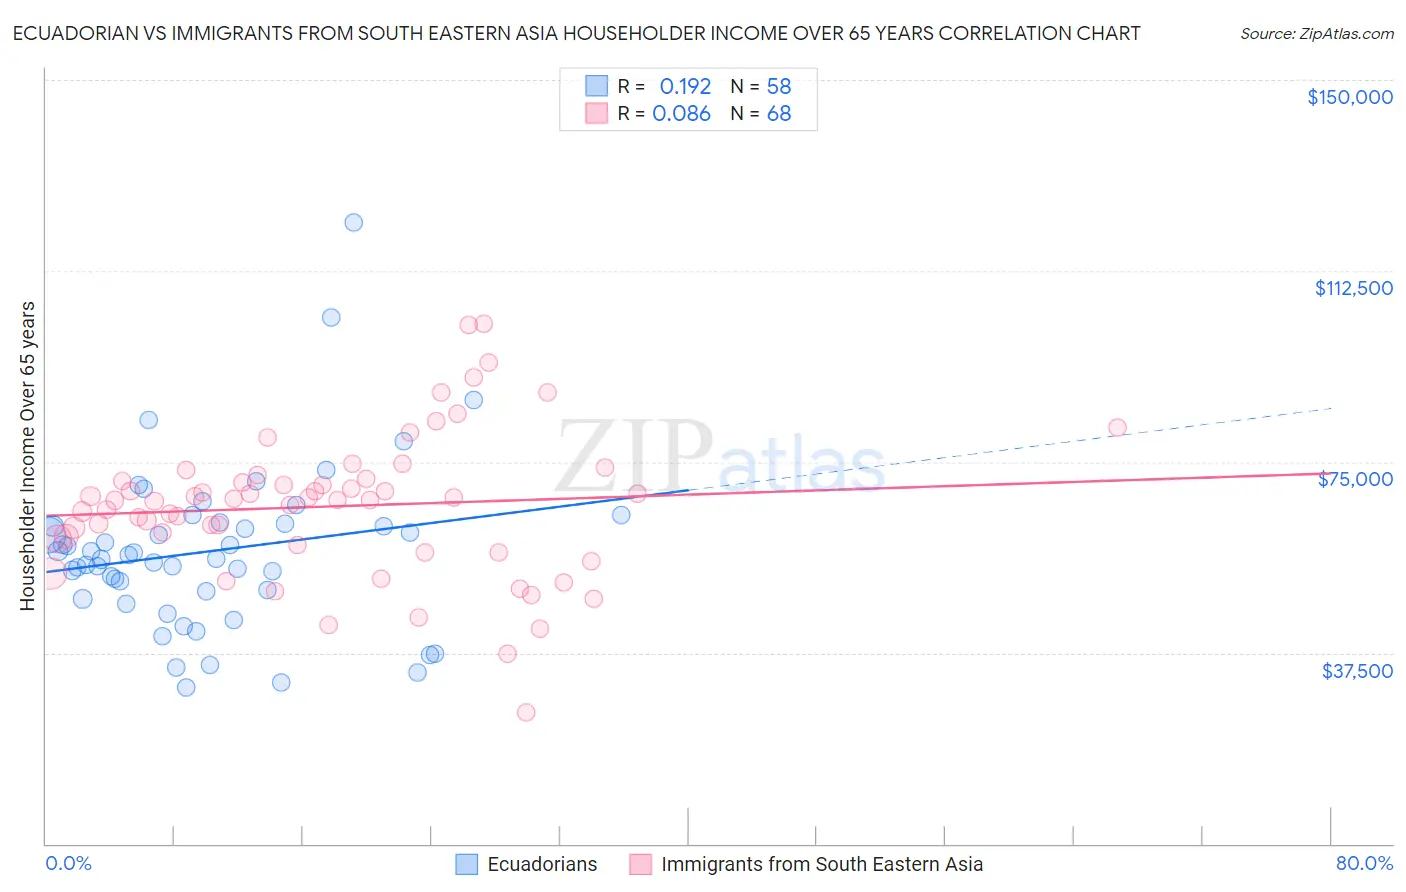
Ecuadorian vs Immigrants from South Eastern Asia Householder Income Over 65 years Correlation Chart
The statistical analysis conducted on geographies consisting of 316,764,939 people shows a poor positive correlation between the proportion of Ecuadorians and household income with householder over the age of 65 in the United States with a correlation coefficient (R) of 0.192 and weighted average of $54,958. Similarly, the statistical analysis conducted on geographies consisting of 509,707,979 people shows a slight positive correlation between the proportion of Immigrants from South Eastern Asia and household income with householder over the age of 65 in the United States with a correlation coefficient (R) of 0.086 and weighted average of $64,089, a difference of 16.6%.
Householder Income Over 65 years Correlation Summary
| Measurement | Ecuadorian | Immigrants from South Eastern Asia |
| Minimum | $30,682 | $25,692 |
| Maximum | $121,912 | $102,052 |
| Range | $91,230 | $76,360 |
| Mean | $57,458 | $66,259 |
| Median | $56,254 | $67,494 |
| Interquartile 25% (IQ1) | $49,530 | $59,292 |
| Interquartile 75% (IQ3) | $62,875 | $71,386 |
| Interquartile Range (IQR) | $13,345 | $12,094 |
| Standard Deviation (Sample) | $16,134 | $14,078 |
| Standard Deviation (Population) | $15,994 | $13,974 |
Similar Demographics by Householder Income Over 65 years
Demographics Similar to Ecuadorians by Householder Income Over 65 years
In terms of householder income over 65 years, the demographic groups most similar to Ecuadorians are West Indian ($54,936, a difference of 0.040%), Immigrants from West Indies ($54,927, a difference of 0.060%), Comanche ($54,922, a difference of 0.070%), Bangladeshi ($54,719, a difference of 0.44%), and French American Indian ($54,699, a difference of 0.47%).
| Demographics | Rating | Rank | Householder Income Over 65 years |
| Immigrants | Portugal | 0.5 /100 | #251 | Tragic $55,924 |
| Osage | 0.4 /100 | #252 | Tragic $55,677 |
| Immigrants | Trinidad and Tobago | 0.4 /100 | #253 | Tragic $55,598 |
| Americans | 0.3 /100 | #254 | Tragic $55,527 |
| Immigrants | Bangladesh | 0.3 /100 | #255 | Tragic $55,394 |
| German Russians | 0.3 /100 | #256 | Tragic $55,356 |
| Trinidadians and Tobagonians | 0.3 /100 | #257 | Tragic $55,327 |
| Ecuadorians | 0.2 /100 | #258 | Tragic $54,958 |
| West Indians | 0.2 /100 | #259 | Tragic $54,936 |
| Immigrants | West Indies | 0.2 /100 | #260 | Tragic $54,927 |
| Comanche | 0.2 /100 | #261 | Tragic $54,922 |
| Bangladeshis | 0.1 /100 | #262 | Tragic $54,719 |
| French American Indians | 0.1 /100 | #263 | Tragic $54,699 |
| Apache | 0.1 /100 | #264 | Tragic $54,668 |
| Belizeans | 0.1 /100 | #265 | Tragic $54,580 |
Demographics Similar to Immigrants from South Eastern Asia by Householder Income Over 65 years
In terms of householder income over 65 years, the demographic groups most similar to Immigrants from South Eastern Asia are Assyrian/Chaldean/Syriac ($64,108, a difference of 0.030%), Immigrants from Italy ($64,065, a difference of 0.040%), Romanian ($64,142, a difference of 0.080%), Sri Lankan ($64,201, a difference of 0.17%), and Chilean ($63,957, a difference of 0.21%).
| Demographics | Rating | Rank | Householder Income Over 65 years |
| Jordanians | 97.1 /100 | #93 | Exceptional $64,313 |
| Immigrants | Egypt | 97.0 /100 | #94 | Exceptional $64,299 |
| Immigrants | Latvia | 97.0 /100 | #95 | Exceptional $64,298 |
| Immigrants | Hungary | 97.0 /100 | #96 | Exceptional $64,277 |
| Sri Lankans | 96.7 /100 | #97 | Exceptional $64,201 |
| Romanians | 96.5 /100 | #98 | Exceptional $64,142 |
| Assyrians/Chaldeans/Syriacs | 96.4 /100 | #99 | Exceptional $64,108 |
| Immigrants | South Eastern Asia | 96.3 /100 | #100 | Exceptional $64,089 |
| Immigrants | Italy | 96.2 /100 | #101 | Exceptional $64,065 |
| Chileans | 95.8 /100 | #102 | Exceptional $63,957 |
| British | 95.7 /100 | #103 | Exceptional $63,940 |
| Immigrants | Cameroon | 95.6 /100 | #104 | Exceptional $63,907 |
| Italians | 95.5 /100 | #105 | Exceptional $63,885 |
| Immigrants | Argentina | 95.5 /100 | #106 | Exceptional $63,885 |
| Pakistanis | 95.3 /100 | #107 | Exceptional $63,844 |