Ghanaian vs Spaniard Householder Income Over 65 years
COMPARE
Ghanaian
Spaniard
Householder Income Over 65 years
Householder Income Over 65 years Comparison
Ghanaians
Spaniards
$60,043
HOUSEHOLDER INCOME OVER 65 YEARS
27.5/ 100
METRIC RATING
189th/ 347
METRIC RANK
$60,866
HOUSEHOLDER INCOME OVER 65 YEARS
47.3/ 100
METRIC RATING
175th/ 347
METRIC RANK
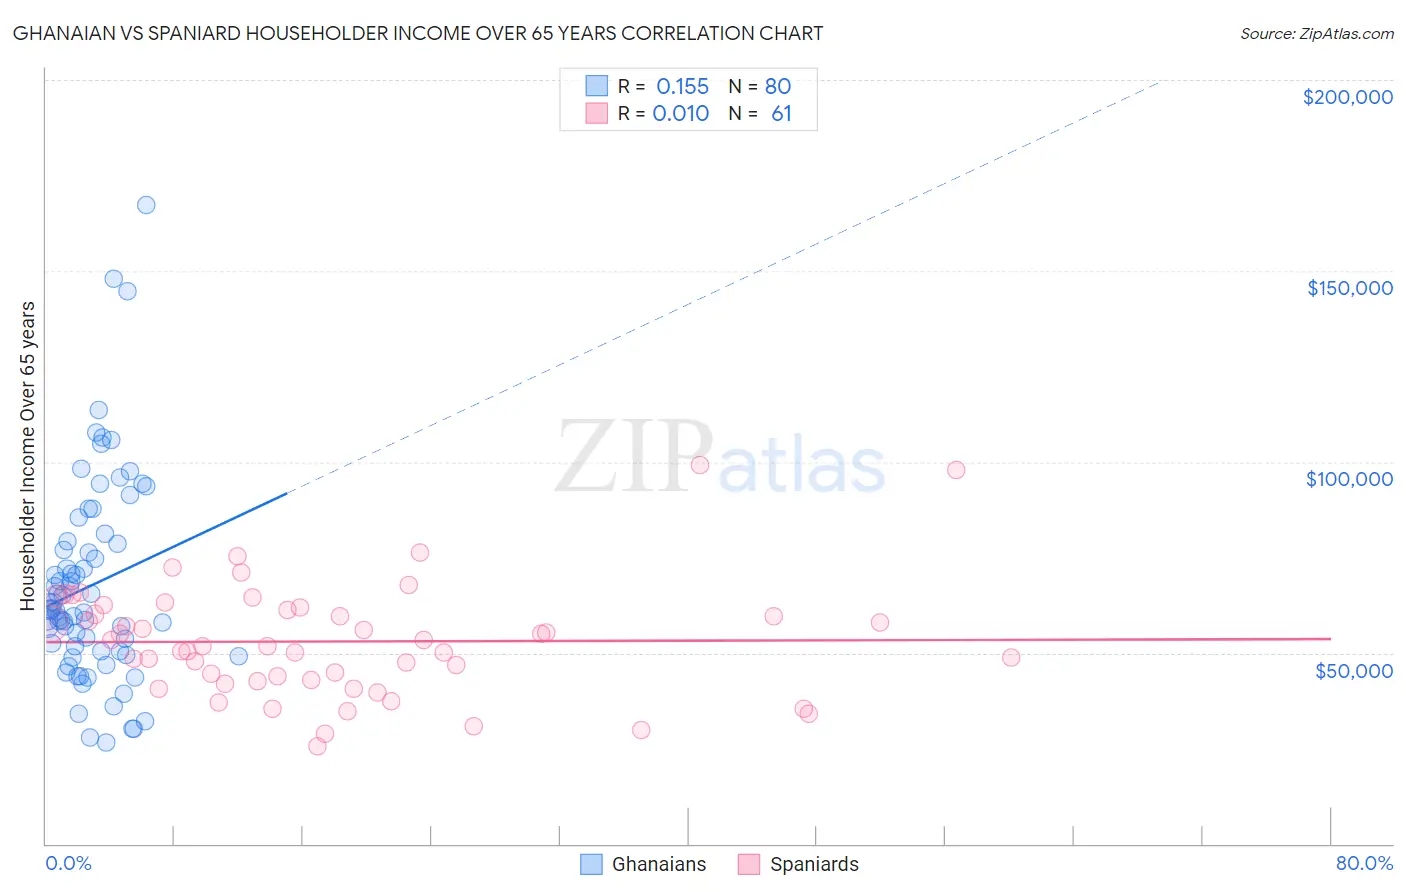
Ghanaian vs Spaniard Householder Income Over 65 years Correlation Chart
The statistical analysis conducted on geographies consisting of 190,075,998 people shows a poor positive correlation between the proportion of Ghanaians and household income with householder over the age of 65 in the United States with a correlation coefficient (R) of 0.155 and weighted average of $60,043. Similarly, the statistical analysis conducted on geographies consisting of 441,402,444 people shows no correlation between the proportion of Spaniards and household income with householder over the age of 65 in the United States with a correlation coefficient (R) of 0.010 and weighted average of $60,866, a difference of 1.4%.
Householder Income Over 65 years Correlation Summary
| Measurement | Ghanaian | Spaniard |
| Minimum | $26,429 | $25,625 |
| Maximum | $167,368 | $99,316 |
| Range | $140,939 | $73,691 |
| Mean | $67,634 | $52,982 |
| Median | $61,218 | $51,848 |
| Interquartile 25% (IQ1) | $50,453 | $42,711 |
| Interquartile 75% (IQ3) | $78,943 | $61,532 |
| Interquartile Range (IQR) | $28,490 | $18,821 |
| Standard Deviation (Sample) | $26,645 | $14,647 |
| Standard Deviation (Population) | $26,478 | $14,526 |
Demographics Similar to Ghanaians and Spaniards by Householder Income Over 65 years
In terms of householder income over 65 years, the demographic groups most similar to Ghanaians are Immigrants from Eritrea ($60,096, a difference of 0.090%), Puget Sound Salish ($59,934, a difference of 0.18%), Belgian ($59,915, a difference of 0.21%), Immigrants from Thailand ($60,217, a difference of 0.29%), and South American ($59,854, a difference of 0.32%). Similarly, the demographic groups most similar to Spaniards are Spanish ($60,795, a difference of 0.12%), Luxembourger ($60,967, a difference of 0.17%), Alaska Native ($60,748, a difference of 0.19%), Immigrants from Micronesia ($61,000, a difference of 0.22%), and Yup'ik ($60,727, a difference of 0.23%).
| Demographics | Rating | Rank | Householder Income Over 65 years |
| Immigrants | Poland | 51.9 /100 | #172 | Average $61,041 |
| Immigrants | Micronesia | 50.8 /100 | #173 | Average $61,000 |
| Luxembourgers | 50.0 /100 | #174 | Average $60,967 |
| Spaniards | 47.3 /100 | #175 | Average $60,866 |
| Spanish | 45.5 /100 | #176 | Average $60,795 |
| Alaska Natives | 44.3 /100 | #177 | Average $60,748 |
| Yup'ik | 43.7 /100 | #178 | Average $60,727 |
| Welsh | 42.2 /100 | #179 | Average $60,666 |
| Immigrants | Morocco | 41.7 /100 | #180 | Average $60,647 |
| Celtics | 40.7 /100 | #181 | Average $60,608 |
| Czechoslovakians | 40.0 /100 | #182 | Average $60,581 |
| Kenyans | 38.4 /100 | #183 | Fair $60,514 |
| Iraqis | 37.2 /100 | #184 | Fair $60,466 |
| Albanians | 32.0 /100 | #185 | Fair $60,249 |
| Slovenes | 31.8 /100 | #186 | Fair $60,241 |
| Immigrants | Thailand | 31.3 /100 | #187 | Fair $60,217 |
| Immigrants | Eritrea | 28.6 /100 | #188 | Fair $60,096 |
| Ghanaians | 27.5 /100 | #189 | Fair $60,043 |
| Puget Sound Salish | 25.3 /100 | #190 | Fair $59,934 |
| Belgians | 24.9 /100 | #191 | Fair $59,915 |
| South Americans | 23.8 /100 | #192 | Fair $59,854 |