Hispanic or Latino vs Taiwanese Householder Income Under 25 years
COMPARE
Hispanic or Latino
Taiwanese
Householder Income Under 25 years
Householder Income Under 25 years Comparison
Hispanics or Latinos
Taiwanese
$50,279
HOUSEHOLDER INCOME UNDER 25 YEARS
0.9/ 100
METRIC RATING
260th/ 347
METRIC RANK
$49,804
HOUSEHOLDER INCOME UNDER 25 YEARS
0.3/ 100
METRIC RATING
271st/ 347
METRIC RANK
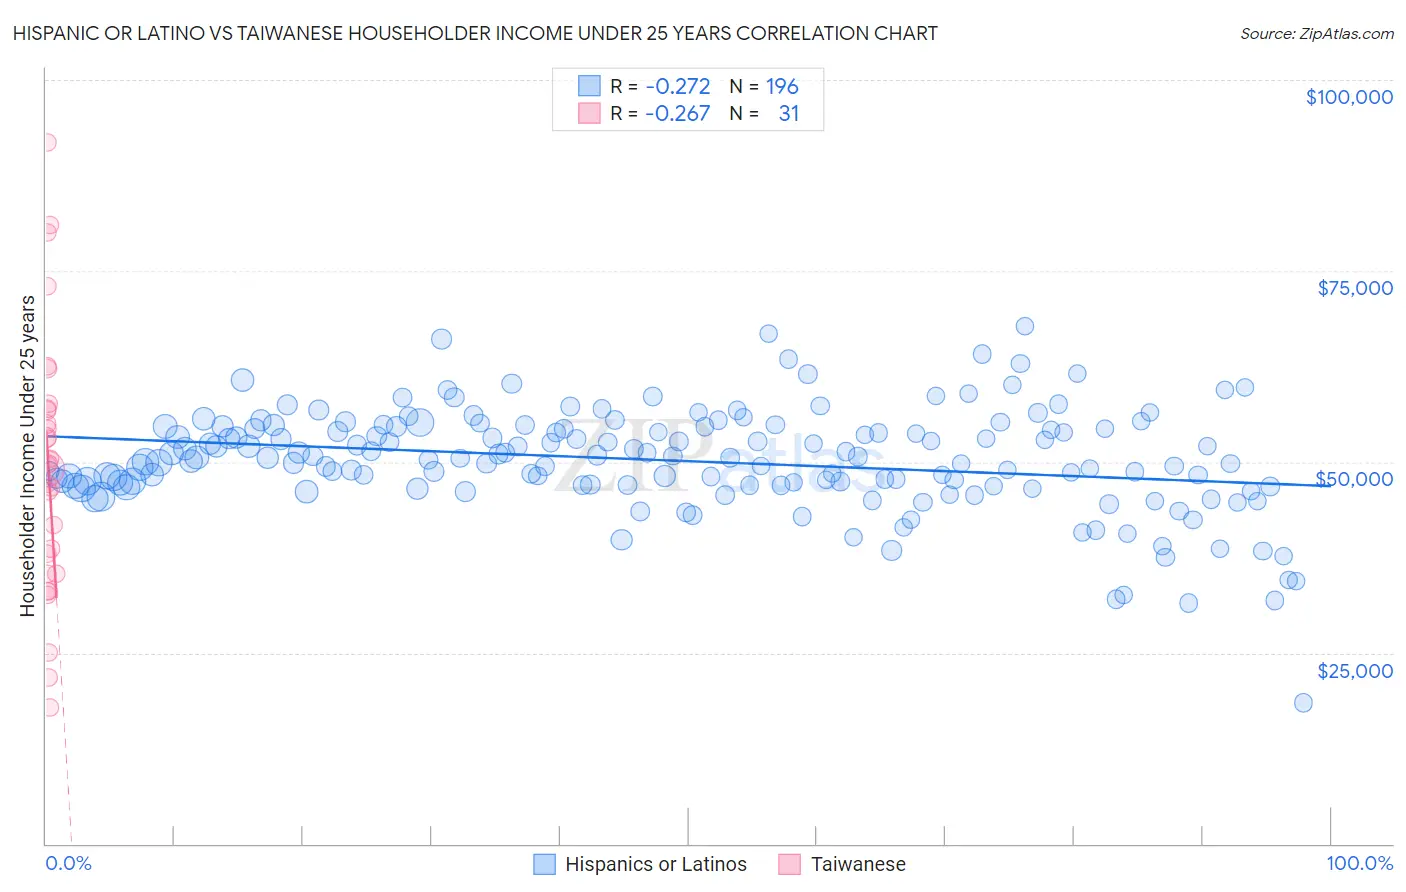
Hispanic or Latino vs Taiwanese Householder Income Under 25 years Correlation Chart
The statistical analysis conducted on geographies consisting of 439,158,266 people shows a weak negative correlation between the proportion of Hispanics or Latinos and household income with householder under the age of 25 in the United States with a correlation coefficient (R) of -0.272 and weighted average of $50,279. Similarly, the statistical analysis conducted on geographies consisting of 31,064,983 people shows a weak negative correlation between the proportion of Taiwanese and household income with householder under the age of 25 in the United States with a correlation coefficient (R) of -0.267 and weighted average of $49,804, a difference of 0.95%.
Householder Income Under 25 years Correlation Summary
| Measurement | Hispanic or Latino | Taiwanese |
| Minimum | $18,454 | $17,865 |
| Maximum | $67,825 | $91,771 |
| Range | $49,371 | $73,906 |
| Mean | $50,152 | $49,314 |
| Median | $50,510 | $49,614 |
| Interquartile 25% (IQ1) | $46,920 | $35,417 |
| Interquartile 75% (IQ3) | $54,505 | $56,998 |
| Interquartile Range (IQR) | $7,585 | $21,581 |
| Standard Deviation (Sample) | $6,817 | $17,111 |
| Standard Deviation (Population) | $6,799 | $16,833 |
Demographics Similar to Hispanics or Latinos and Taiwanese by Householder Income Under 25 years
In terms of householder income under 25 years, the demographic groups most similar to Hispanics or Latinos are Immigrants from Dominica ($50,301, a difference of 0.040%), Hungarian ($50,247, a difference of 0.060%), Haitian ($50,231, a difference of 0.10%), White/Caucasian ($50,336, a difference of 0.11%), and Lebanese ($50,355, a difference of 0.15%). Similarly, the demographic groups most similar to Taiwanese are Colville ($49,774, a difference of 0.060%), Slovak ($49,753, a difference of 0.10%), Immigrants from Senegal ($49,742, a difference of 0.12%), Immigrants from Kenya ($49,633, a difference of 0.34%), and Mexican ($49,989, a difference of 0.37%).
| Demographics | Rating | Rank | Householder Income Under 25 years |
| Aleuts | 1.2 /100 | #255 | Tragic $50,377 |
| Immigrants | Cuba | 1.2 /100 | #256 | Tragic $50,374 |
| Lebanese | 1.1 /100 | #257 | Tragic $50,355 |
| Whites/Caucasians | 1.1 /100 | #258 | Tragic $50,336 |
| Immigrants | Dominica | 1.0 /100 | #259 | Tragic $50,301 |
| Hispanics or Latinos | 0.9 /100 | #260 | Tragic $50,279 |
| Hungarians | 0.9 /100 | #261 | Tragic $50,247 |
| Haitians | 0.8 /100 | #262 | Tragic $50,231 |
| Immigrants | Dominican Republic | 0.8 /100 | #263 | Tragic $50,204 |
| Fijians | 0.6 /100 | #264 | Tragic $50,132 |
| Belgians | 0.6 /100 | #265 | Tragic $50,113 |
| Immigrants | Venezuela | 0.6 /100 | #266 | Tragic $50,109 |
| Immigrants | Laos | 0.5 /100 | #267 | Tragic $50,041 |
| Venezuelans | 0.5 /100 | #268 | Tragic $50,011 |
| Ute | 0.5 /100 | #269 | Tragic $49,997 |
| Mexicans | 0.5 /100 | #270 | Tragic $49,989 |
| Taiwanese | 0.3 /100 | #271 | Tragic $49,804 |
| Colville | 0.3 /100 | #272 | Tragic $49,774 |
| Slovaks | 0.3 /100 | #273 | Tragic $49,753 |
| Immigrants | Senegal | 0.3 /100 | #274 | Tragic $49,742 |
| Immigrants | Kenya | 0.2 /100 | #275 | Tragic $49,633 |