Immigrants from Afghanistan vs Immigrants from Haiti Householder Income Over 65 years
COMPARE
Immigrants from Afghanistan
Immigrants from Haiti
Householder Income Over 65 years
Householder Income Over 65 years Comparison
Immigrants from Afghanistan
Immigrants from Haiti
$67,007
HOUSEHOLDER INCOME OVER 65 YEARS
99.8/ 100
METRIC RATING
45th/ 347
METRIC RANK
$51,219
HOUSEHOLDER INCOME OVER 65 YEARS
0.0/ 100
METRIC RATING
325th/ 347
METRIC RANK
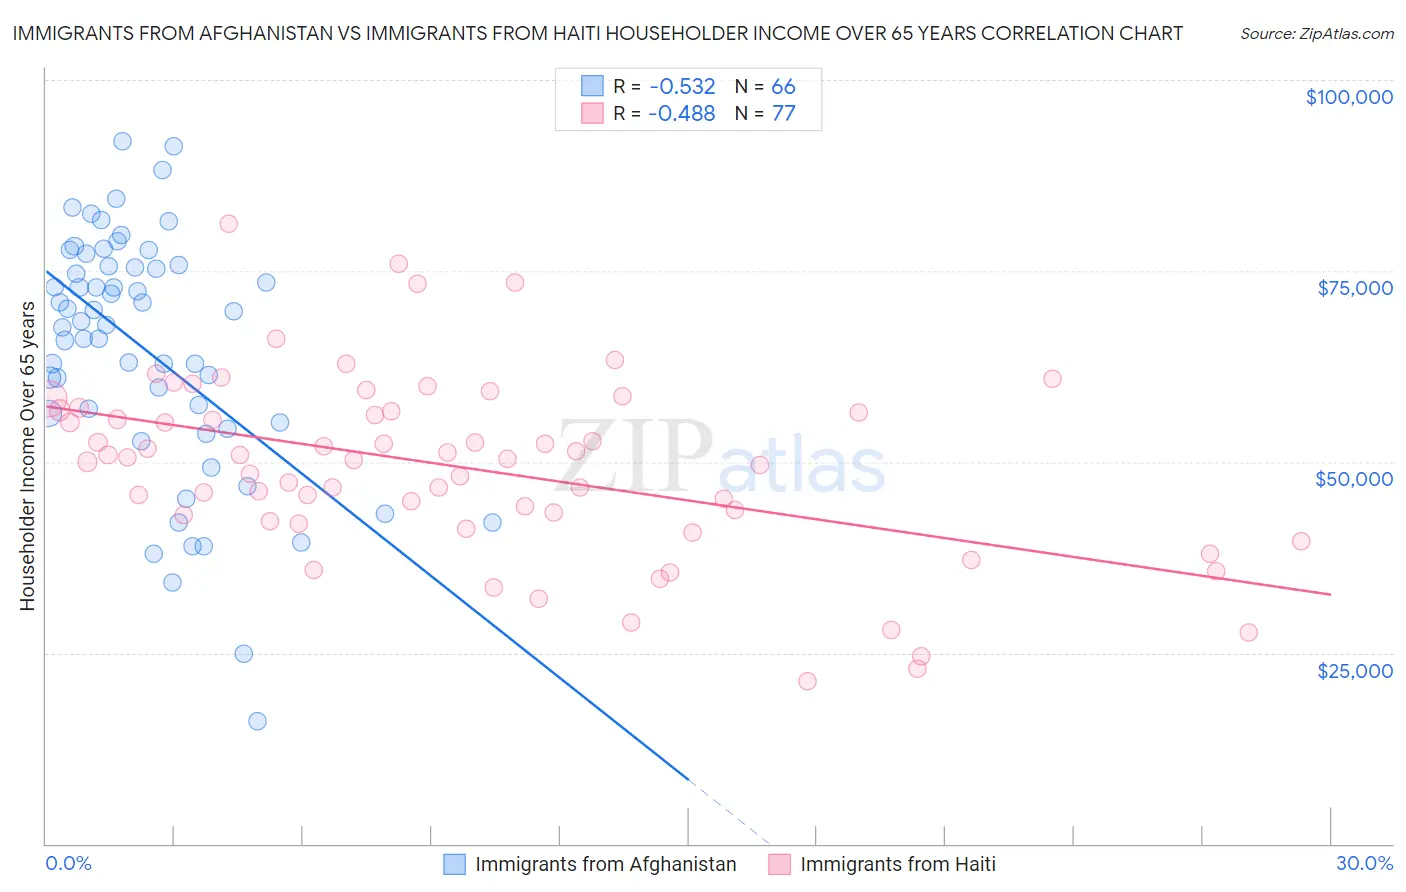
Immigrants from Afghanistan vs Immigrants from Haiti Householder Income Over 65 years Correlation Chart
The statistical analysis conducted on geographies consisting of 147,467,112 people shows a substantial negative correlation between the proportion of Immigrants from Afghanistan and household income with householder over the age of 65 in the United States with a correlation coefficient (R) of -0.532 and weighted average of $67,007. Similarly, the statistical analysis conducted on geographies consisting of 224,664,590 people shows a moderate negative correlation between the proportion of Immigrants from Haiti and household income with householder over the age of 65 in the United States with a correlation coefficient (R) of -0.488 and weighted average of $51,219, a difference of 30.8%.
Householder Income Over 65 years Correlation Summary
| Measurement | Immigrants from Afghanistan | Immigrants from Haiti |
| Minimum | $16,042 | $21,207 |
| Maximum | $92,051 | $81,196 |
| Range | $76,009 | $59,989 |
| Mean | $64,426 | $49,285 |
| Median | $68,184 | $50,337 |
| Interquartile 25% (IQ1) | $55,130 | $42,656 |
| Interquartile 75% (IQ3) | $75,556 | $56,737 |
| Interquartile Range (IQR) | $20,426 | $14,081 |
| Standard Deviation (Sample) | $16,099 | $11,917 |
| Standard Deviation (Population) | $15,977 | $11,839 |
Similar Demographics by Householder Income Over 65 years
Demographics Similar to Immigrants from Afghanistan by Householder Income Over 65 years
In terms of householder income over 65 years, the demographic groups most similar to Immigrants from Afghanistan are Cambodian ($66,892, a difference of 0.17%), Australian ($66,891, a difference of 0.17%), Immigrants from France ($66,826, a difference of 0.27%), Immigrants from South Africa ($67,234, a difference of 0.34%), and Immigrants from Indonesia ($66,694, a difference of 0.47%).
| Demographics | Rating | Rank | Householder Income Over 65 years |
| Estonians | 99.9 /100 | #38 | Exceptional $67,926 |
| Russians | 99.9 /100 | #39 | Exceptional $67,626 |
| Immigrants | Asia | 99.9 /100 | #40 | Exceptional $67,594 |
| Koreans | 99.9 /100 | #41 | Exceptional $67,472 |
| New Zealanders | 99.9 /100 | #42 | Exceptional $67,333 |
| Latvians | 99.9 /100 | #43 | Exceptional $67,326 |
| Immigrants | South Africa | 99.9 /100 | #44 | Exceptional $67,234 |
| Immigrants | Afghanistan | 99.8 /100 | #45 | Exceptional $67,007 |
| Cambodians | 99.8 /100 | #46 | Exceptional $66,892 |
| Australians | 99.8 /100 | #47 | Exceptional $66,891 |
| Immigrants | France | 99.8 /100 | #48 | Exceptional $66,826 |
| Immigrants | Indonesia | 99.8 /100 | #49 | Exceptional $66,694 |
| Immigrants | Turkey | 99.7 /100 | #50 | Exceptional $66,672 |
| Israelis | 99.7 /100 | #51 | Exceptional $66,636 |
| Immigrants | Scotland | 99.7 /100 | #52 | Exceptional $66,620 |
Demographics Similar to Immigrants from Haiti by Householder Income Over 65 years
In terms of householder income over 65 years, the demographic groups most similar to Immigrants from Haiti are Kiowa ($51,140, a difference of 0.15%), Immigrants from Congo ($51,393, a difference of 0.34%), Cajun ($51,397, a difference of 0.35%), Bahamian ($51,000, a difference of 0.43%), and British West Indian ($51,463, a difference of 0.47%).
| Demographics | Rating | Rank | Householder Income Over 65 years |
| Haitians | 0.0 /100 | #318 | Tragic $51,912 |
| Immigrants | Honduras | 0.0 /100 | #319 | Tragic $51,888 |
| Colville | 0.0 /100 | #320 | Tragic $51,739 |
| Menominee | 0.0 /100 | #321 | Tragic $51,719 |
| British West Indians | 0.0 /100 | #322 | Tragic $51,463 |
| Cajuns | 0.0 /100 | #323 | Tragic $51,397 |
| Immigrants | Congo | 0.0 /100 | #324 | Tragic $51,393 |
| Immigrants | Haiti | 0.0 /100 | #325 | Tragic $51,219 |
| Kiowa | 0.0 /100 | #326 | Tragic $51,140 |
| Bahamians | 0.0 /100 | #327 | Tragic $51,000 |
| Hopi | 0.0 /100 | #328 | Tragic $50,925 |
| Blacks/African Americans | 0.0 /100 | #329 | Tragic $50,779 |
| Immigrants | Grenada | 0.0 /100 | #330 | Tragic $50,747 |
| Pima | 0.0 /100 | #331 | Tragic $50,539 |
| Dutch West Indians | 0.0 /100 | #332 | Tragic $50,475 |