Immigrants from Africa vs Immigrants from Portugal Per Capita Income
COMPARE
Immigrants from Africa
Immigrants from Portugal
Per Capita Income
Per Capita Income Comparison
Immigrants from Africa
Immigrants from Portugal
$42,950
PER CAPITA INCOME
31.0/ 100
METRIC RATING
188th/ 347
METRIC RANK
$42,412
PER CAPITA INCOME
19.7/ 100
METRIC RATING
198th/ 347
METRIC RANK
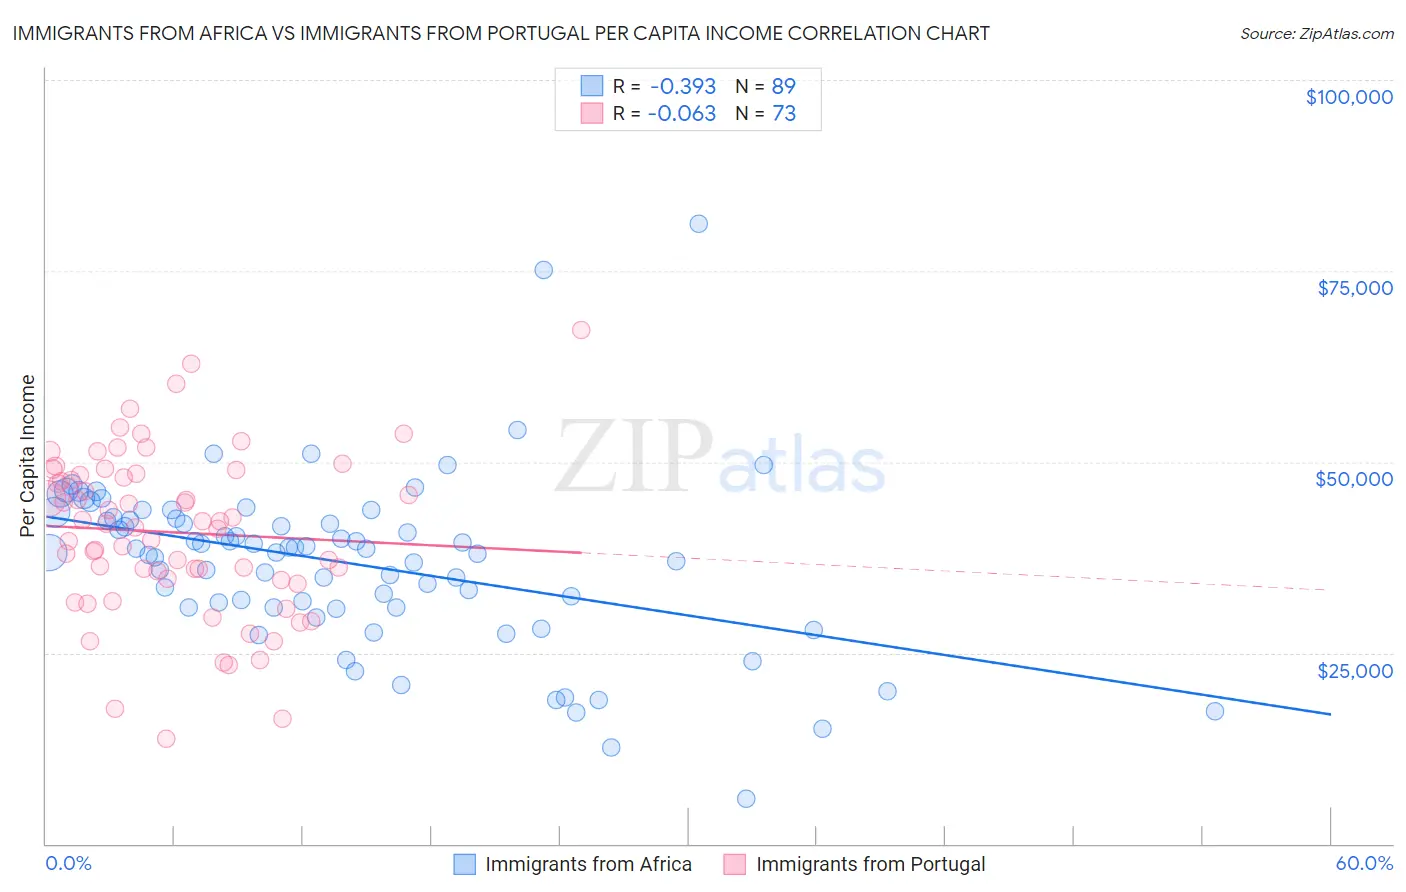
Immigrants from Africa vs Immigrants from Portugal Per Capita Income Correlation Chart
The statistical analysis conducted on geographies consisting of 469,482,271 people shows a mild negative correlation between the proportion of Immigrants from Africa and per capita income in the United States with a correlation coefficient (R) of -0.393 and weighted average of $42,950. Similarly, the statistical analysis conducted on geographies consisting of 174,792,548 people shows a slight negative correlation between the proportion of Immigrants from Portugal and per capita income in the United States with a correlation coefficient (R) of -0.063 and weighted average of $42,412, a difference of 1.3%.
Per Capita Income Correlation Summary
| Measurement | Immigrants from Africa | Immigrants from Portugal |
| Minimum | $5,866 | $13,756 |
| Maximum | $81,151 | $67,338 |
| Range | $75,285 | $53,582 |
| Mean | $36,831 | $40,766 |
| Median | $38,619 | $41,948 |
| Interquartile 25% (IQ1) | $30,955 | $34,644 |
| Interquartile 75% (IQ3) | $42,606 | $48,401 |
| Interquartile Range (IQR) | $11,650 | $13,757 |
| Standard Deviation (Sample) | $11,377 | $10,670 |
| Standard Deviation (Population) | $11,312 | $10,597 |
Demographics Similar to Immigrants from Africa and Immigrants from Portugal by Per Capita Income
In terms of per capita income, the demographic groups most similar to Immigrants from Africa are Immigrants from Colombia ($42,971, a difference of 0.050%), Bermudan ($42,911, a difference of 0.090%), French Canadian ($43,003, a difference of 0.12%), Immigrants ($43,010, a difference of 0.14%), and Spaniard ($43,028, a difference of 0.18%). Similarly, the demographic groups most similar to Immigrants from Portugal are Barbadian ($42,406, a difference of 0.010%), Vietnamese ($42,368, a difference of 0.10%), Immigrants from Thailand ($42,289, a difference of 0.29%), Immigrants from Bosnia and Herzegovina ($42,278, a difference of 0.32%), and Scotch-Irish ($42,563, a difference of 0.36%).
| Demographics | Rating | Rank | Per Capita Income |
| Germans | 33.9 /100 | #183 | Fair $43,067 |
| Spaniards | 32.9 /100 | #184 | Fair $43,028 |
| Immigrants | Immigrants | 32.5 /100 | #185 | Fair $43,010 |
| French Canadians | 32.3 /100 | #186 | Fair $43,003 |
| Immigrants | Colombia | 31.5 /100 | #187 | Fair $42,971 |
| Immigrants | Africa | 31.0 /100 | #188 | Fair $42,950 |
| Bermudans | 30.1 /100 | #189 | Fair $42,911 |
| Kenyans | 27.7 /100 | #190 | Fair $42,808 |
| Yugoslavians | 27.4 /100 | #191 | Fair $42,792 |
| Iraqis | 26.7 /100 | #192 | Fair $42,760 |
| Immigrants | Sierra Leone | 26.5 /100 | #193 | Fair $42,752 |
| Immigrants | Fiji | 25.2 /100 | #194 | Fair $42,694 |
| Immigrants | Kenya | 24.5 /100 | #195 | Fair $42,661 |
| Dutch | 23.4 /100 | #196 | Fair $42,605 |
| Scotch-Irish | 22.6 /100 | #197 | Fair $42,563 |
| Immigrants | Portugal | 19.7 /100 | #198 | Poor $42,412 |
| Barbadians | 19.6 /100 | #199 | Poor $42,406 |
| Vietnamese | 19.0 /100 | #200 | Poor $42,368 |
| Immigrants | Thailand | 17.6 /100 | #201 | Poor $42,289 |
| Immigrants | Bosnia and Herzegovina | 17.5 /100 | #202 | Poor $42,278 |
| Spanish | 17.0 /100 | #203 | Poor $42,249 |