Immigrants from Belgium vs Spanish Householder Income Ages 45 - 64 years
COMPARE
Immigrants from Belgium
Spanish
Householder Income Ages 45 - 64 years
Householder Income Ages 45 - 64 years Comparison
Immigrants from Belgium
Spanish
$118,932
HOUSEHOLDER INCOME AGES 45 - 64 YEARS
100.0/ 100
METRIC RATING
22nd/ 347
METRIC RANK
$98,554
HOUSEHOLDER INCOME AGES 45 - 64 YEARS
29.2/ 100
METRIC RATING
195th/ 347
METRIC RANK
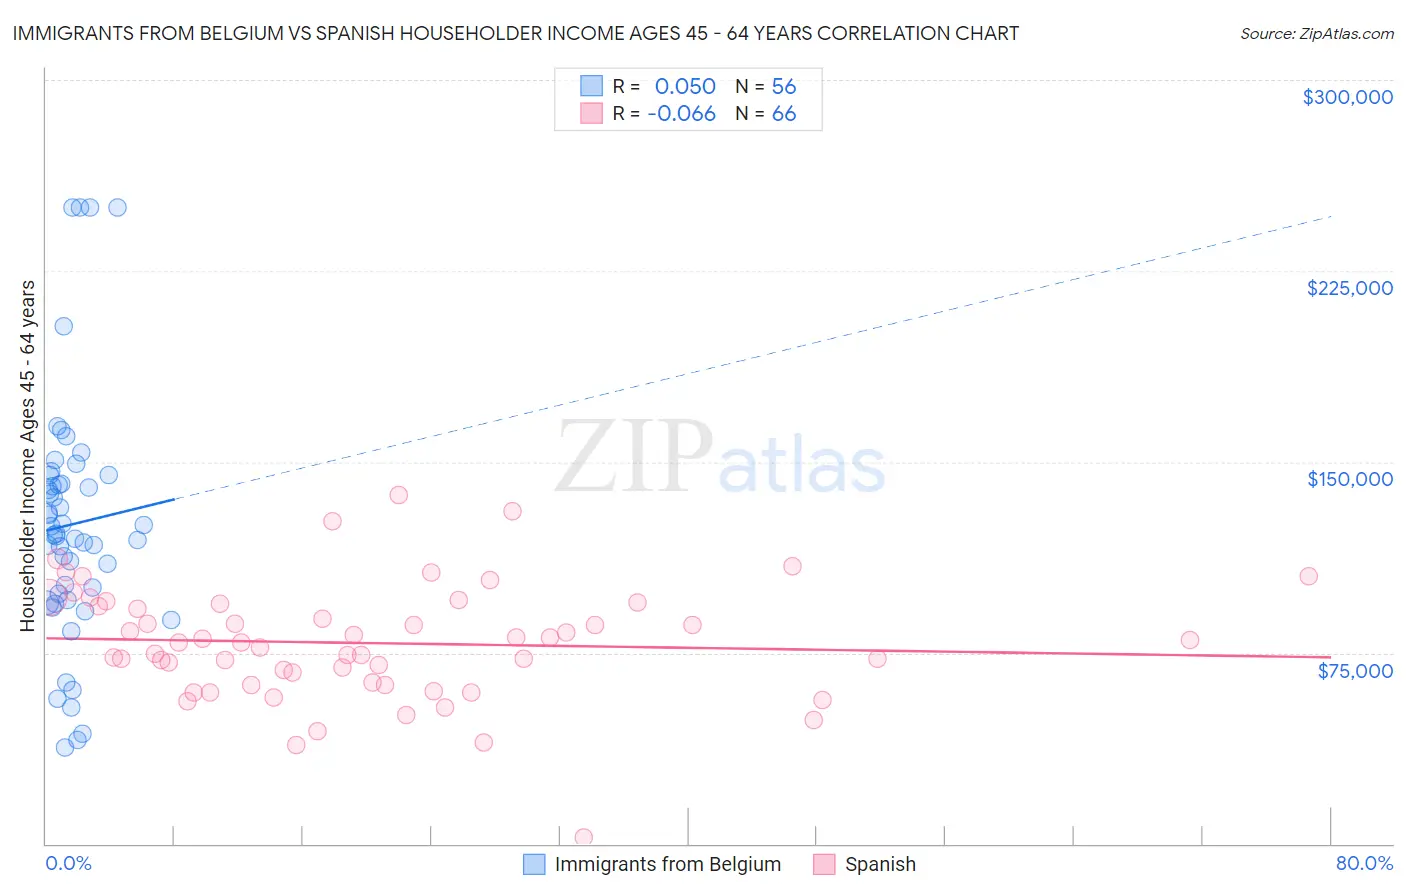
Immigrants from Belgium vs Spanish Householder Income Ages 45 - 64 years Correlation Chart
The statistical analysis conducted on geographies consisting of 146,611,057 people shows a slight positive correlation between the proportion of Immigrants from Belgium and household income with householder between the ages 45 and 64 in the United States with a correlation coefficient (R) of 0.050 and weighted average of $118,932. Similarly, the statistical analysis conducted on geographies consisting of 421,243,274 people shows a slight negative correlation between the proportion of Spanish and household income with householder between the ages 45 and 64 in the United States with a correlation coefficient (R) of -0.066 and weighted average of $98,554, a difference of 20.7%.
Householder Income Ages 45 - 64 years Correlation Summary
| Measurement | Immigrants from Belgium | Spanish |
| Minimum | $38,026 | $2,499 |
| Maximum | $250,001 | $137,143 |
| Range | $211,975 | $134,644 |
| Mean | $125,440 | $78,857 |
| Median | $121,589 | $79,247 |
| Interquartile 25% (IQ1) | $96,886 | $63,421 |
| Interquartile 75% (IQ3) | $142,973 | $94,394 |
| Interquartile Range (IQR) | $46,087 | $30,972 |
| Standard Deviation (Sample) | $48,145 | $22,794 |
| Standard Deviation (Population) | $47,713 | $22,620 |
Similar Demographics by Householder Income Ages 45 - 64 years
Demographics Similar to Immigrants from Belgium by Householder Income Ages 45 - 64 years
In terms of householder income ages 45 - 64 years, the demographic groups most similar to Immigrants from Belgium are Bolivian ($118,871, a difference of 0.050%), Immigrants from Sri Lanka ($119,094, a difference of 0.14%), Immigrants from Australia ($119,308, a difference of 0.32%), Immigrants from Japan ($118,498, a difference of 0.37%), and Asian ($118,426, a difference of 0.43%).
| Demographics | Rating | Rank | Householder Income Ages 45 - 64 years |
| Immigrants | Eastern Asia | 100.0 /100 | #15 | Exceptional $122,222 |
| Immigrants | China | 100.0 /100 | #16 | Exceptional $122,178 |
| Burmese | 100.0 /100 | #17 | Exceptional $121,444 |
| Immigrants | Korea | 100.0 /100 | #18 | Exceptional $121,243 |
| Eastern Europeans | 100.0 /100 | #19 | Exceptional $120,684 |
| Immigrants | Australia | 100.0 /100 | #20 | Exceptional $119,308 |
| Immigrants | Sri Lanka | 100.0 /100 | #21 | Exceptional $119,094 |
| Immigrants | Belgium | 100.0 /100 | #22 | Exceptional $118,932 |
| Bolivians | 100.0 /100 | #23 | Exceptional $118,871 |
| Immigrants | Japan | 100.0 /100 | #24 | Exceptional $118,498 |
| Asians | 100.0 /100 | #25 | Exceptional $118,426 |
| Immigrants | Sweden | 100.0 /100 | #26 | Exceptional $118,318 |
| Immigrants | Northern Europe | 100.0 /100 | #27 | Exceptional $117,930 |
| Turks | 100.0 /100 | #28 | Exceptional $117,814 |
| Bhutanese | 100.0 /100 | #29 | Exceptional $117,750 |
Demographics Similar to Spanish by Householder Income Ages 45 - 64 years
In terms of householder income ages 45 - 64 years, the demographic groups most similar to Spanish are Immigrants from Eastern Africa ($98,467, a difference of 0.090%), Uruguayan ($98,660, a difference of 0.11%), Puget Sound Salish ($98,340, a difference of 0.22%), Hawaiian ($98,778, a difference of 0.23%), and Celtic ($98,896, a difference of 0.35%).
| Demographics | Rating | Rank | Householder Income Ages 45 - 64 years |
| Immigrants | Portugal | 36.3 /100 | #188 | Fair $99,203 |
| Immigrants | South America | 35.4 /100 | #189 | Fair $99,126 |
| French Canadians | 35.1 /100 | #190 | Fair $99,093 |
| Kenyans | 33.7 /100 | #191 | Fair $98,970 |
| Celtics | 32.9 /100 | #192 | Fair $98,896 |
| Hawaiians | 31.6 /100 | #193 | Fair $98,778 |
| Uruguayans | 30.3 /100 | #194 | Fair $98,660 |
| Spanish | 29.2 /100 | #195 | Fair $98,554 |
| Immigrants | Eastern Africa | 28.3 /100 | #196 | Fair $98,467 |
| Puget Sound Salish | 27.0 /100 | #197 | Fair $98,340 |
| Immigrants | Iraq | 25.7 /100 | #198 | Fair $98,201 |
| Whites/Caucasians | 24.6 /100 | #199 | Fair $98,091 |
| Immigrants | Kenya | 23.5 /100 | #200 | Fair $97,964 |
| Yugoslavians | 20.0 /100 | #201 | Fair $97,558 |
| Tlingit-Haida | 18.9 /100 | #202 | Poor $97,417 |