Immigrants from Burma/Myanmar vs Japanese Median Family Income
COMPARE
Immigrants from Burma/Myanmar
Japanese
Median Family Income
Median Family Income Comparison
Immigrants from Burma/Myanmar
Japanese
$94,472
MEDIAN FAMILY INCOME
1.5/ 100
METRIC RATING
235th/ 347
METRIC RANK
$97,288
MEDIAN FAMILY INCOME
6.0/ 100
METRIC RATING
217th/ 347
METRIC RANK
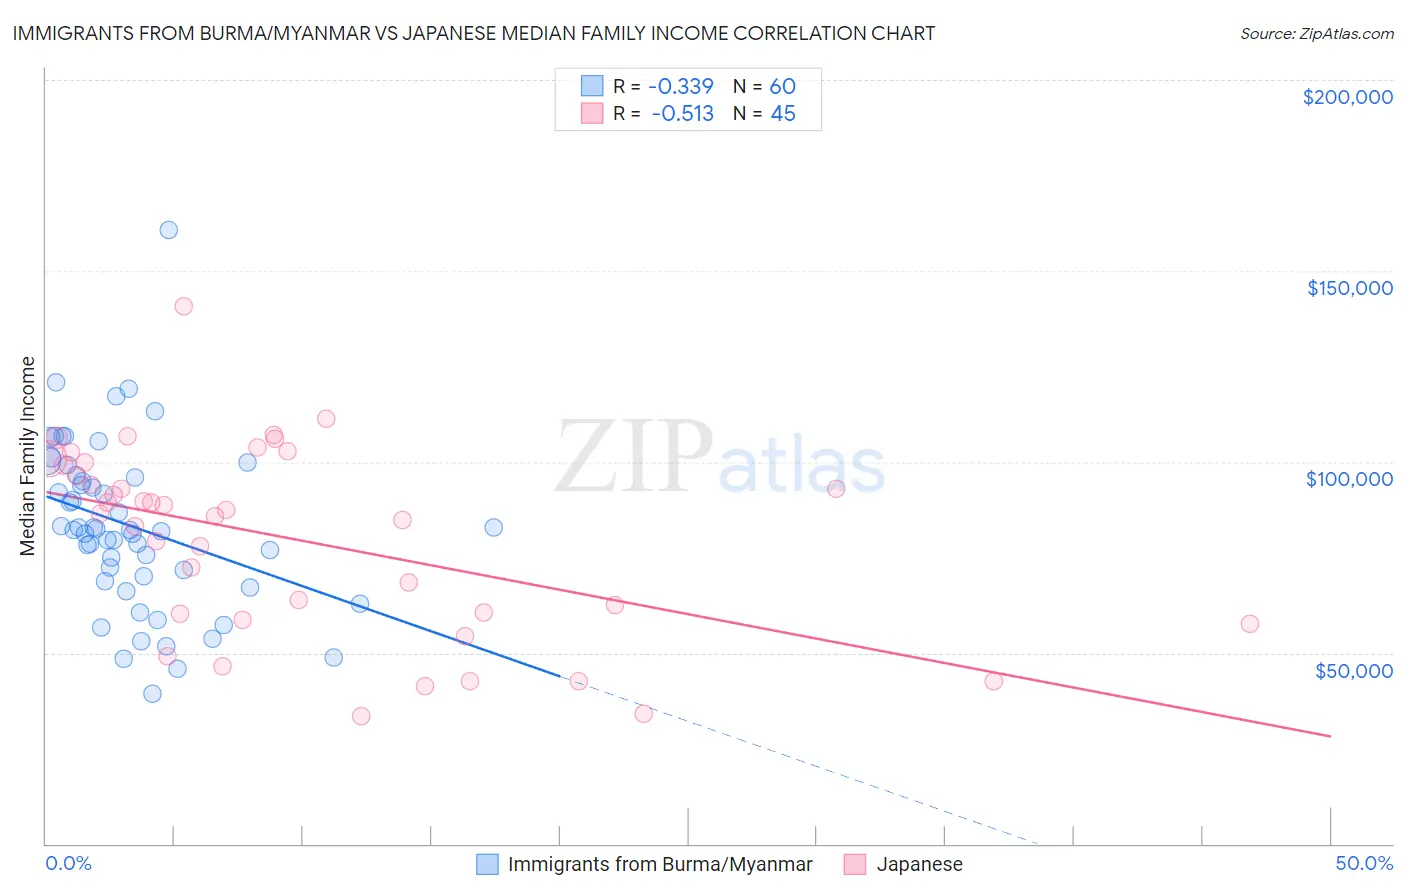
Immigrants from Burma/Myanmar vs Japanese Median Family Income Correlation Chart
The statistical analysis conducted on geographies consisting of 172,231,822 people shows a mild negative correlation between the proportion of Immigrants from Burma/Myanmar and median family income in the United States with a correlation coefficient (R) of -0.339 and weighted average of $94,472. Similarly, the statistical analysis conducted on geographies consisting of 249,024,827 people shows a substantial negative correlation between the proportion of Japanese and median family income in the United States with a correlation coefficient (R) of -0.513 and weighted average of $97,288, a difference of 3.0%.
Median Family Income Correlation Summary
| Measurement | Immigrants from Burma/Myanmar | Japanese |
| Minimum | $39,136 | $33,448 |
| Maximum | $160,863 | $140,649 |
| Range | $121,727 | $107,201 |
| Mean | $83,083 | $79,706 |
| Median | $82,122 | $86,545 |
| Interquartile 25% (IQ1) | $69,331 | $59,337 |
| Interquartile 75% (IQ3) | $96,286 | $99,518 |
| Interquartile Range (IQR) | $26,955 | $40,181 |
| Standard Deviation (Sample) | $21,974 | $24,734 |
| Standard Deviation (Population) | $21,790 | $24,457 |
Demographics Similar to Immigrants from Burma/Myanmar and Japanese by Median Family Income
In terms of median family income, the demographic groups most similar to Immigrants from Burma/Myanmar are Trinidadian and Tobagonian ($94,466, a difference of 0.010%), Immigrants from Western Africa ($94,638, a difference of 0.18%), Immigrants from Bangladesh ($94,665, a difference of 0.20%), Immigrants from Venezuela ($94,904, a difference of 0.46%), and Ecuadorian ($95,114, a difference of 0.68%). Similarly, the demographic groups most similar to Japanese are Immigrants from Cambodia ($97,222, a difference of 0.070%), Immigrants from Bosnia and Herzegovina ($97,432, a difference of 0.15%), Delaware ($96,958, a difference of 0.34%), Sudanese ($96,783, a difference of 0.52%), and Immigrants from Ghana ($96,544, a difference of 0.77%).
| Demographics | Rating | Rank | Median Family Income |
| Immigrants | Bosnia and Herzegovina | 6.4 /100 | #216 | Tragic $97,432 |
| Japanese | 6.0 /100 | #217 | Tragic $97,288 |
| Immigrants | Cambodia | 5.8 /100 | #218 | Tragic $97,222 |
| Delaware | 5.1 /100 | #219 | Tragic $96,958 |
| Sudanese | 4.7 /100 | #220 | Tragic $96,783 |
| Immigrants | Ghana | 4.2 /100 | #221 | Tragic $96,544 |
| Immigrants | Nigeria | 4.0 /100 | #222 | Tragic $96,439 |
| Venezuelans | 3.7 /100 | #223 | Tragic $96,281 |
| Immigrants | Nonimmigrants | 3.6 /100 | #224 | Tragic $96,231 |
| Vietnamese | 3.4 /100 | #225 | Tragic $96,123 |
| Immigrants | Panama | 2.7 /100 | #226 | Tragic $95,647 |
| Alaska Natives | 2.6 /100 | #227 | Tragic $95,573 |
| Immigrants | Azores | 2.4 /100 | #228 | Tragic $95,402 |
| Marshallese | 2.2 /100 | #229 | Tragic $95,293 |
| Malaysians | 2.2 /100 | #230 | Tragic $95,230 |
| Ecuadorians | 2.1 /100 | #231 | Tragic $95,114 |
| Immigrants | Venezuela | 1.9 /100 | #232 | Tragic $94,904 |
| Immigrants | Bangladesh | 1.6 /100 | #233 | Tragic $94,665 |
| Immigrants | Western Africa | 1.6 /100 | #234 | Tragic $94,638 |
| Immigrants | Burma/Myanmar | 1.5 /100 | #235 | Tragic $94,472 |
| Trinidadians and Tobagonians | 1.5 /100 | #236 | Tragic $94,466 |