Immigrants from Congo vs Pennsylvania German Householder Income Ages 25 - 44 years
COMPARE
Immigrants from Congo
Pennsylvania German
Householder Income Ages 25 - 44 years
Householder Income Ages 25 - 44 years Comparison
Immigrants from Congo
Pennsylvania Germans
$72,178
HOUSEHOLDER INCOME AGES 25 - 44 YEARS
0.0/ 100
METRIC RATING
340th/ 347
METRIC RANK
$85,836
HOUSEHOLDER INCOME AGES 25 - 44 YEARS
0.8/ 100
METRIC RATING
250th/ 347
METRIC RANK
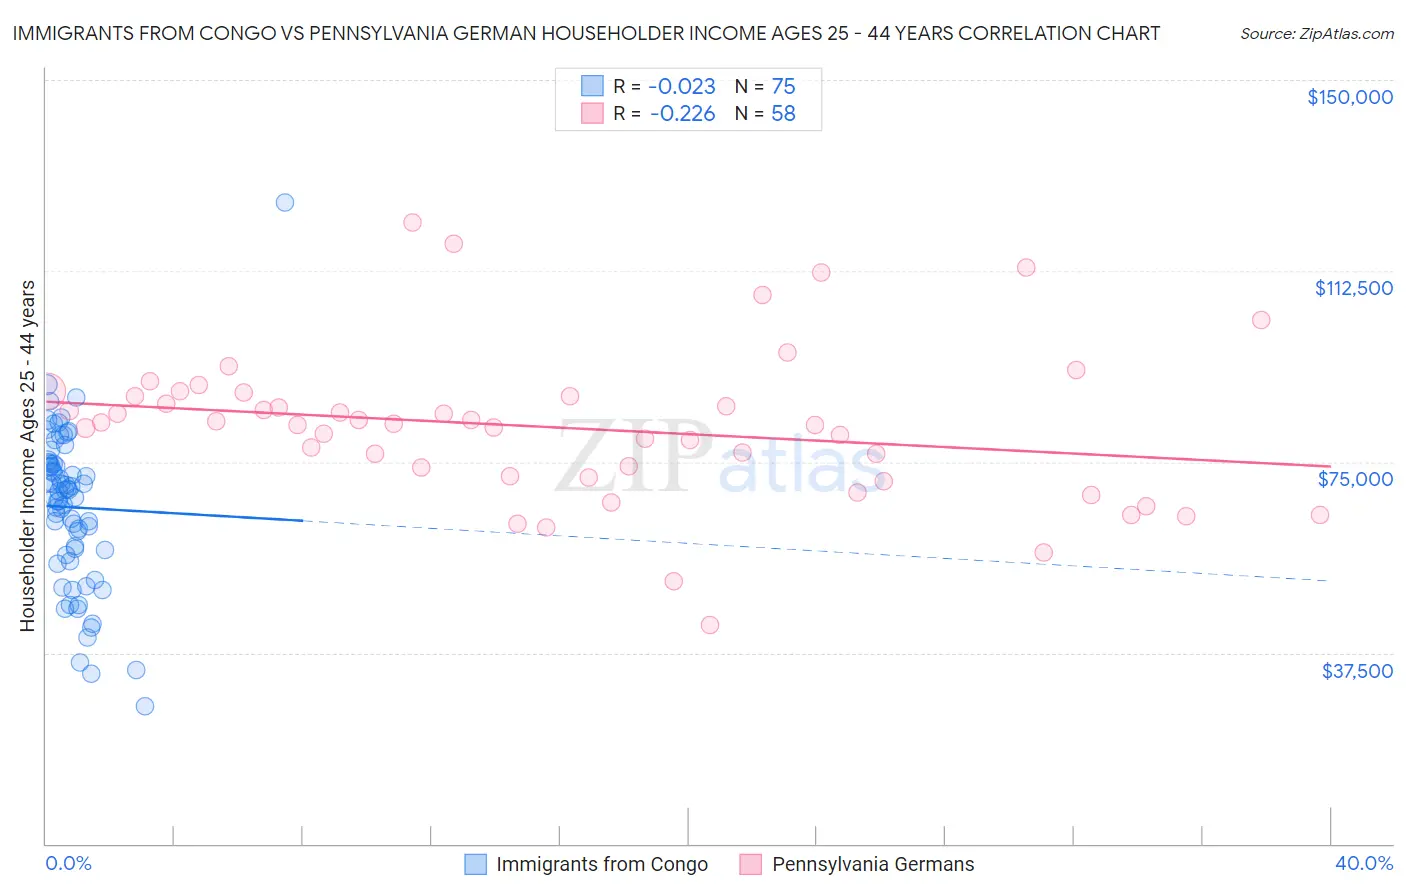
Immigrants from Congo vs Pennsylvania German Householder Income Ages 25 - 44 years Correlation Chart
The statistical analysis conducted on geographies consisting of 92,043,798 people shows no correlation between the proportion of Immigrants from Congo and household income with householder between the ages 25 and 44 in the United States with a correlation coefficient (R) of -0.023 and weighted average of $72,178. Similarly, the statistical analysis conducted on geographies consisting of 233,340,356 people shows a weak negative correlation between the proportion of Pennsylvania Germans and household income with householder between the ages 25 and 44 in the United States with a correlation coefficient (R) of -0.226 and weighted average of $85,836, a difference of 18.9%.
Householder Income Ages 25 - 44 years Correlation Summary
| Measurement | Immigrants from Congo | Pennsylvania German |
| Minimum | $27,125 | $42,875 |
| Maximum | $125,889 | $121,909 |
| Range | $98,764 | $79,034 |
| Mean | $66,077 | $81,694 |
| Median | $69,302 | $82,382 |
| Interquartile 25% (IQ1) | $56,796 | $72,120 |
| Interquartile 75% (IQ3) | $74,591 | $87,825 |
| Interquartile Range (IQR) | $17,795 | $15,704 |
| Standard Deviation (Sample) | $15,700 | $15,048 |
| Standard Deviation (Population) | $15,595 | $14,918 |
Similar Demographics by Householder Income Ages 25 - 44 years
Demographics Similar to Immigrants from Congo by Householder Income Ages 25 - 44 years
In terms of householder income ages 25 - 44 years, the demographic groups most similar to Immigrants from Congo are Arapaho ($71,697, a difference of 0.67%), Yuman ($72,956, a difference of 1.1%), Crow ($71,337, a difference of 1.2%), Immigrants from Yemen ($73,043, a difference of 1.2%), and Black/African American ($73,370, a difference of 1.7%).
| Demographics | Rating | Rank | Householder Income Ages 25 - 44 years |
| Hopi | 0.0 /100 | #333 | Tragic $75,002 |
| Creek | 0.0 /100 | #334 | Tragic $74,847 |
| Kiowa | 0.0 /100 | #335 | Tragic $74,776 |
| Yup'ik | 0.0 /100 | #336 | Tragic $73,688 |
| Blacks/African Americans | 0.0 /100 | #337 | Tragic $73,370 |
| Immigrants | Yemen | 0.0 /100 | #338 | Tragic $73,043 |
| Yuman | 0.0 /100 | #339 | Tragic $72,956 |
| Immigrants | Congo | 0.0 /100 | #340 | Tragic $72,178 |
| Arapaho | 0.0 /100 | #341 | Tragic $71,697 |
| Crow | 0.0 /100 | #342 | Tragic $71,337 |
| Tohono O'odham | 0.0 /100 | #343 | Tragic $69,068 |
| Pueblo | 0.0 /100 | #344 | Tragic $68,910 |
| Navajo | 0.0 /100 | #345 | Tragic $66,529 |
| Puerto Ricans | 0.0 /100 | #346 | Tragic $65,996 |
| Lumbee | 0.0 /100 | #347 | Tragic $60,305 |
Demographics Similar to Pennsylvania Germans by Householder Income Ages 25 - 44 years
In terms of householder income ages 25 - 44 years, the demographic groups most similar to Pennsylvania Germans are French American Indian ($85,899, a difference of 0.070%), Cape Verdean ($85,758, a difference of 0.090%), Immigrants from Western Africa ($85,676, a difference of 0.19%), Immigrants from Sudan ($86,109, a difference of 0.32%), and British West Indian ($85,565, a difference of 0.32%).
| Demographics | Rating | Rank | Householder Income Ages 25 - 44 years |
| Immigrants | West Indies | 1.5 /100 | #243 | Tragic $87,063 |
| Immigrants | Venezuela | 1.5 /100 | #244 | Tragic $87,038 |
| Immigrants | El Salvador | 1.4 /100 | #245 | Tragic $86,913 |
| Immigrants | Burma/Myanmar | 1.3 /100 | #246 | Tragic $86,736 |
| Immigrants | Nigeria | 1.2 /100 | #247 | Tragic $86,589 |
| Immigrants | Sudan | 0.9 /100 | #248 | Tragic $86,109 |
| French American Indians | 0.8 /100 | #249 | Tragic $85,899 |
| Pennsylvania Germans | 0.8 /100 | #250 | Tragic $85,836 |
| Cape Verdeans | 0.8 /100 | #251 | Tragic $85,758 |
| Immigrants | Western Africa | 0.7 /100 | #252 | Tragic $85,676 |
| British West Indians | 0.7 /100 | #253 | Tragic $85,565 |
| Immigrants | Laos | 0.7 /100 | #254 | Tragic $85,553 |
| German Russians | 0.6 /100 | #255 | Tragic $85,220 |
| Central Americans | 0.5 /100 | #256 | Tragic $85,144 |
| Mexican American Indians | 0.5 /100 | #257 | Tragic $85,066 |