Immigrants from Costa Rica vs Crow Median Household Income
COMPARE
Immigrants from Costa Rica
Crow
Median Household Income
Median Household Income Comparison
Immigrants from Costa Rica
Crow
$85,054
MEDIAN HOUSEHOLD INCOME
49.2/ 100
METRIC RATING
175th/ 347
METRIC RANK
$63,681
MEDIAN HOUSEHOLD INCOME
0.0/ 100
METRIC RATING
341st/ 347
METRIC RANK
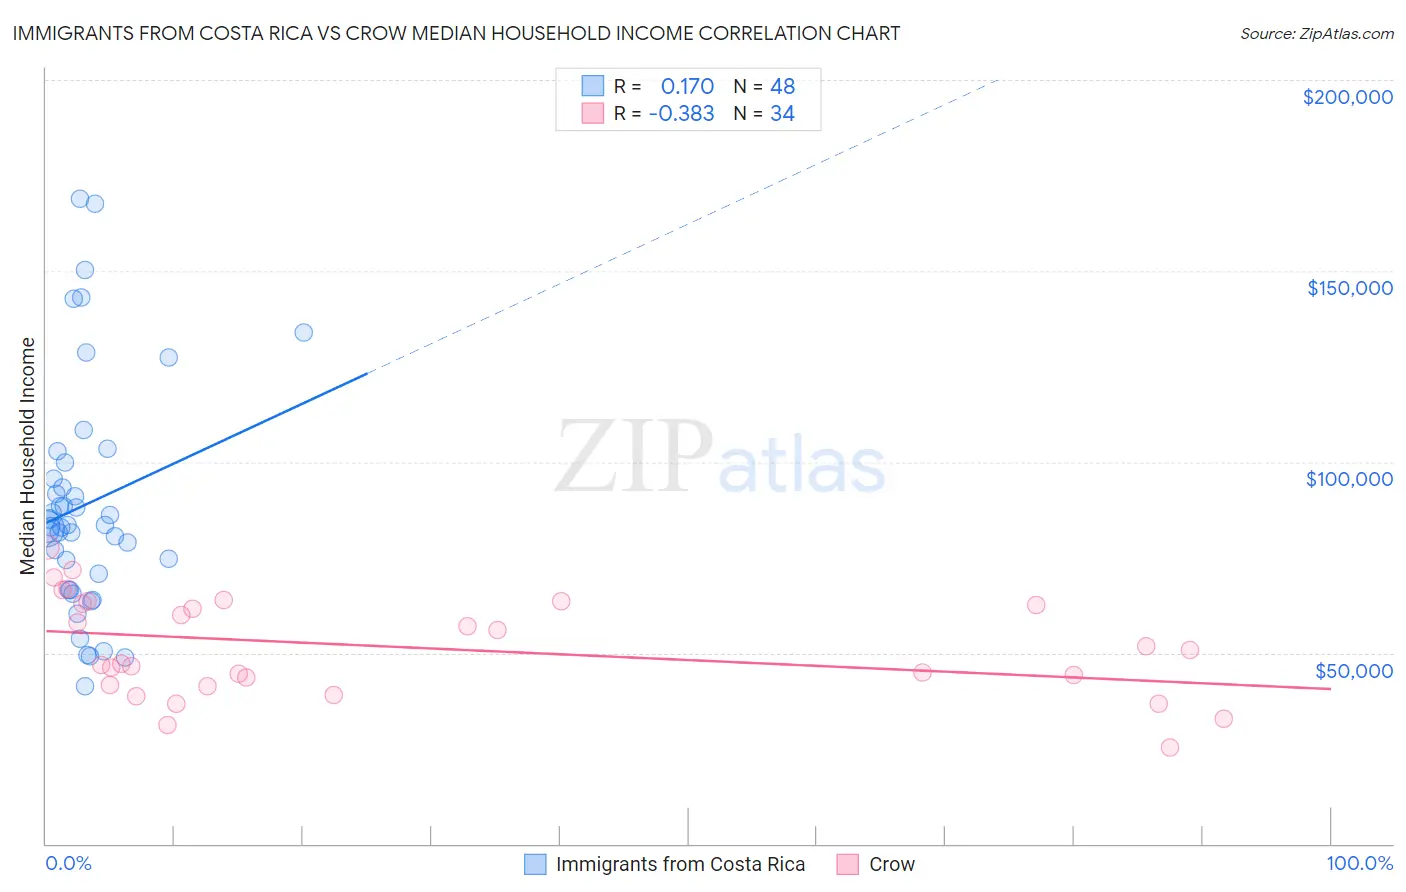
Immigrants from Costa Rica vs Crow Median Household Income Correlation Chart
The statistical analysis conducted on geographies consisting of 204,222,655 people shows a poor positive correlation between the proportion of Immigrants from Costa Rica and median household income in the United States with a correlation coefficient (R) of 0.170 and weighted average of $85,054. Similarly, the statistical analysis conducted on geographies consisting of 59,197,360 people shows a mild negative correlation between the proportion of Crow and median household income in the United States with a correlation coefficient (R) of -0.383 and weighted average of $63,681, a difference of 33.6%.
Median Household Income Correlation Summary
| Measurement | Immigrants from Costa Rica | Crow |
| Minimum | $41,250 | $25,179 |
| Maximum | $168,837 | $77,725 |
| Range | $127,587 | $52,546 |
| Mean | $88,867 | $51,476 |
| Median | $83,191 | $48,948 |
| Interquartile 25% (IQ1) | $68,706 | $41,650 |
| Interquartile 75% (IQ3) | $97,715 | $62,906 |
| Interquartile Range (IQR) | $29,008 | $21,256 |
| Standard Deviation (Sample) | $30,266 | $12,984 |
| Standard Deviation (Population) | $29,949 | $12,792 |
Similar Demographics by Median Household Income
Demographics Similar to Immigrants from Costa Rica by Median Household Income
In terms of median household income, the demographic groups most similar to Immigrants from Costa Rica are Alsatian ($85,053, a difference of 0.0%), Immigrants from Eritrea ($85,025, a difference of 0.030%), Scottish ($85,101, a difference of 0.050%), Czechoslovakian ($84,965, a difference of 0.10%), and English ($84,915, a difference of 0.16%).
| Demographics | Rating | Rank | Median Household Income |
| Icelanders | 61.0 /100 | #168 | Good $85,797 |
| Colombians | 59.7 /100 | #169 | Average $85,716 |
| Swiss | 59.2 /100 | #170 | Average $85,681 |
| Immigrants | South America | 58.1 /100 | #171 | Average $85,611 |
| Slovenes | 57.4 /100 | #172 | Average $85,562 |
| Immigrants | Cameroon | 53.4 /100 | #173 | Average $85,314 |
| Scottish | 50.0 /100 | #174 | Average $85,101 |
| Immigrants | Costa Rica | 49.2 /100 | #175 | Average $85,054 |
| Alsatians | 49.2 /100 | #176 | Average $85,053 |
| Immigrants | Eritrea | 48.8 /100 | #177 | Average $85,025 |
| Czechoslovakians | 47.8 /100 | #178 | Average $84,965 |
| English | 47.0 /100 | #179 | Average $84,915 |
| Immigrants | Portugal | 44.2 /100 | #180 | Average $84,740 |
| Hawaiians | 44.1 /100 | #181 | Average $84,729 |
| Uruguayans | 43.5 /100 | #182 | Average $84,691 |
Demographics Similar to Crow by Median Household Income
In terms of median household income, the demographic groups most similar to Crow are Pima ($63,262, a difference of 0.66%), Pueblo ($64,692, a difference of 1.6%), Houma ($62,575, a difference of 1.8%), Hopi ($65,043, a difference of 2.1%), and Immigrants from Yemen ($65,194, a difference of 2.4%).
| Demographics | Rating | Rank | Median Household Income |
| Creek | 0.0 /100 | #333 | Tragic $67,715 |
| Blacks/African Americans | 0.0 /100 | #334 | Tragic $67,573 |
| Cheyenne | 0.0 /100 | #335 | Tragic $66,974 |
| Immigrants | Congo | 0.0 /100 | #336 | Tragic $66,768 |
| Kiowa | 0.0 /100 | #337 | Tragic $65,914 |
| Immigrants | Yemen | 0.0 /100 | #338 | Tragic $65,194 |
| Hopi | 0.0 /100 | #339 | Tragic $65,043 |
| Pueblo | 0.0 /100 | #340 | Tragic $64,692 |
| Crow | 0.0 /100 | #341 | Tragic $63,681 |
| Pima | 0.0 /100 | #342 | Tragic $63,262 |
| Houma | 0.0 /100 | #343 | Tragic $62,575 |
| Tohono O'odham | 0.0 /100 | #344 | Tragic $61,663 |
| Puerto Ricans | 0.0 /100 | #345 | Tragic $59,197 |
| Navajo | 0.0 /100 | #346 | Tragic $59,159 |
| Lumbee | 0.0 /100 | #347 | Tragic $54,644 |