Immigrants from Cuba vs Argentinean Householder Income Ages 25 - 44 years
COMPARE
Immigrants from Cuba
Argentinean
Householder Income Ages 25 - 44 years
Householder Income Ages 25 - 44 years Comparison
Immigrants from Cuba
Argentineans
$76,701
HOUSEHOLDER INCOME AGES 25 - 44 YEARS
0.0/ 100
METRIC RATING
328th/ 347
METRIC RANK
$103,111
HOUSEHOLDER INCOME AGES 25 - 44 YEARS
99.1/ 100
METRIC RATING
83rd/ 347
METRIC RANK
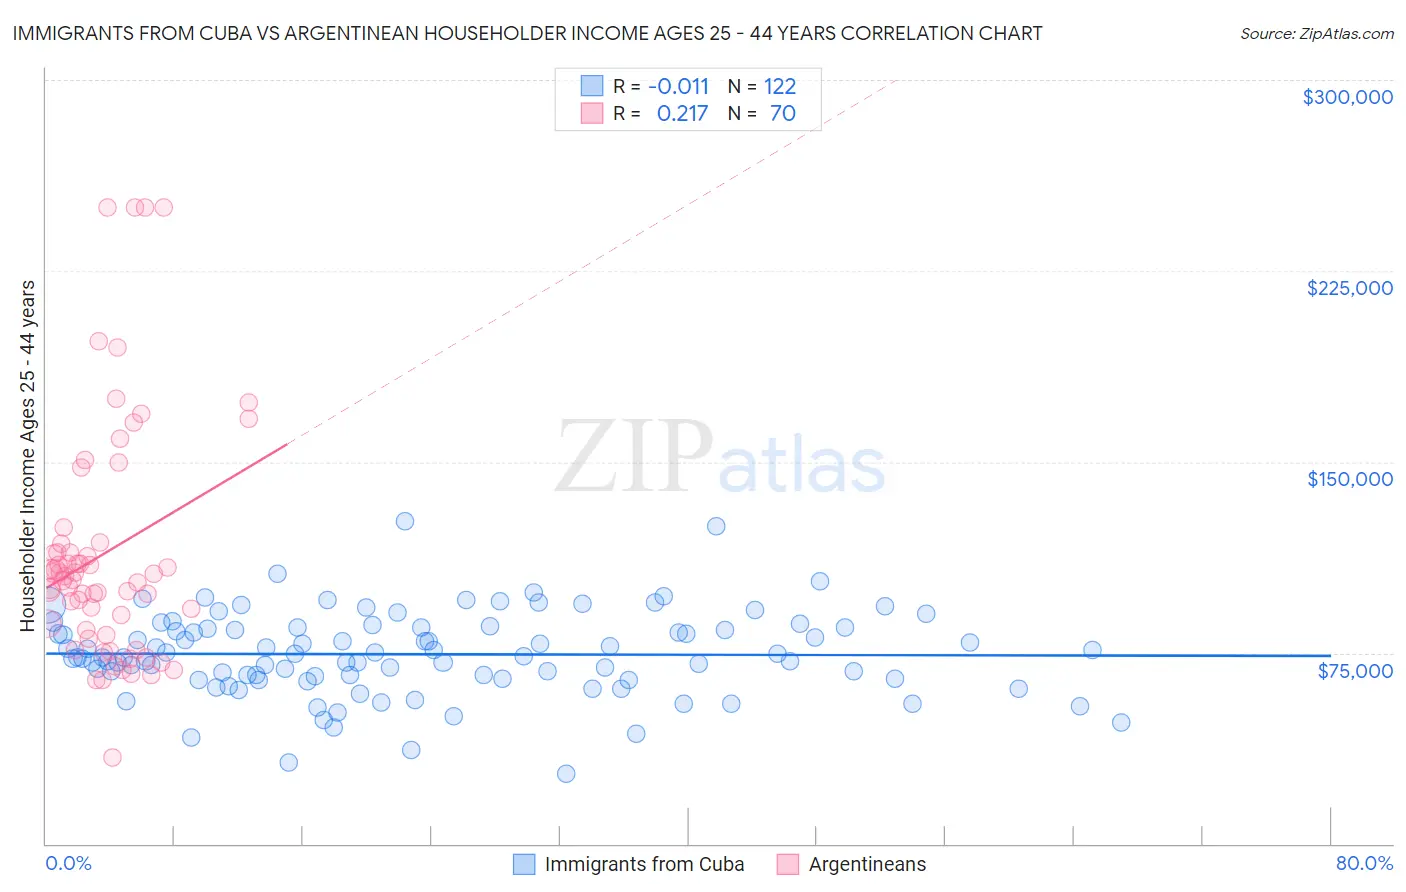
Immigrants from Cuba vs Argentinean Householder Income Ages 25 - 44 years Correlation Chart
The statistical analysis conducted on geographies consisting of 325,310,013 people shows no correlation between the proportion of Immigrants from Cuba and household income with householder between the ages 25 and 44 in the United States with a correlation coefficient (R) of -0.011 and weighted average of $76,701. Similarly, the statistical analysis conducted on geographies consisting of 296,719,437 people shows a weak positive correlation between the proportion of Argentineans and household income with householder between the ages 25 and 44 in the United States with a correlation coefficient (R) of 0.217 and weighted average of $103,111, a difference of 34.4%.
Householder Income Ages 25 - 44 years Correlation Summary
| Measurement | Immigrants from Cuba | Argentinean |
| Minimum | $27,269 | $33,750 |
| Maximum | $126,663 | $250,001 |
| Range | $99,394 | $216,251 |
| Mean | $74,412 | $114,200 |
| Median | $73,548 | $104,423 |
| Interquartile 25% (IQ1) | $64,878 | $84,111 |
| Interquartile 75% (IQ3) | $84,816 | $117,920 |
| Interquartile Range (IQR) | $19,938 | $33,809 |
| Standard Deviation (Sample) | $16,521 | $46,765 |
| Standard Deviation (Population) | $16,454 | $46,430 |
Similar Demographics by Householder Income Ages 25 - 44 years
Demographics Similar to Immigrants from Cuba by Householder Income Ages 25 - 44 years
In terms of householder income ages 25 - 44 years, the demographic groups most similar to Immigrants from Cuba are Seminole ($76,584, a difference of 0.15%), Immigrants from Bahamas ($76,910, a difference of 0.27%), Houma ($77,044, a difference of 0.45%), Sioux ($77,089, a difference of 0.51%), and Yakama ($76,226, a difference of 0.62%).
| Demographics | Rating | Rank | Householder Income Ages 25 - 44 years |
| Immigrants | Zaire | 0.0 /100 | #321 | Tragic $78,045 |
| Chickasaw | 0.0 /100 | #322 | Tragic $77,929 |
| Immigrants | Honduras | 0.0 /100 | #323 | Tragic $77,328 |
| Dutch West Indians | 0.0 /100 | #324 | Tragic $77,260 |
| Sioux | 0.0 /100 | #325 | Tragic $77,089 |
| Houma | 0.0 /100 | #326 | Tragic $77,044 |
| Immigrants | Bahamas | 0.0 /100 | #327 | Tragic $76,910 |
| Immigrants | Cuba | 0.0 /100 | #328 | Tragic $76,701 |
| Seminole | 0.0 /100 | #329 | Tragic $76,584 |
| Yakama | 0.0 /100 | #330 | Tragic $76,226 |
| Natives/Alaskans | 0.0 /100 | #331 | Tragic $75,647 |
| Bahamians | 0.0 /100 | #332 | Tragic $75,395 |
| Hopi | 0.0 /100 | #333 | Tragic $75,002 |
| Creek | 0.0 /100 | #334 | Tragic $74,847 |
| Kiowa | 0.0 /100 | #335 | Tragic $74,776 |
Demographics Similar to Argentineans by Householder Income Ages 25 - 44 years
In terms of householder income ages 25 - 44 years, the demographic groups most similar to Argentineans are Immigrants from Serbia ($103,155, a difference of 0.040%), South African ($103,160, a difference of 0.050%), Immigrants from Egypt ($103,192, a difference of 0.080%), Armenian ($103,248, a difference of 0.13%), and Immigrants from Philippines ($102,910, a difference of 0.20%).
| Demographics | Rating | Rank | Householder Income Ages 25 - 44 years |
| Immigrants | Spain | 99.4 /100 | #76 | Exceptional $103,752 |
| Immigrants | Southern Europe | 99.3 /100 | #77 | Exceptional $103,486 |
| Immigrants | Bulgaria | 99.3 /100 | #78 | Exceptional $103,423 |
| Armenians | 99.2 /100 | #79 | Exceptional $103,248 |
| Immigrants | Egypt | 99.2 /100 | #80 | Exceptional $103,192 |
| South Africans | 99.2 /100 | #81 | Exceptional $103,160 |
| Immigrants | Serbia | 99.2 /100 | #82 | Exceptional $103,155 |
| Argentineans | 99.1 /100 | #83 | Exceptional $103,111 |
| Immigrants | Philippines | 99.0 /100 | #84 | Exceptional $102,910 |
| Immigrants | Ukraine | 98.9 /100 | #85 | Exceptional $102,664 |
| Immigrants | Hungary | 98.9 /100 | #86 | Exceptional $102,655 |
| Immigrants | Western Europe | 98.9 /100 | #87 | Exceptional $102,654 |
| Immigrants | Canada | 98.9 /100 | #88 | Exceptional $102,616 |
| Romanians | 98.8 /100 | #89 | Exceptional $102,544 |
| Ukrainians | 98.8 /100 | #90 | Exceptional $102,451 |