Immigrants from Dominica vs Salvadoran Per Capita Income
COMPARE
Immigrants from Dominica
Salvadoran
Per Capita Income
Per Capita Income Comparison
Immigrants from Dominica
Salvadorans
$37,952
PER CAPITA INCOME
0.2/ 100
METRIC RATING
281st/ 347
METRIC RANK
$38,858
PER CAPITA INCOME
0.5/ 100
METRIC RATING
266th/ 347
METRIC RANK
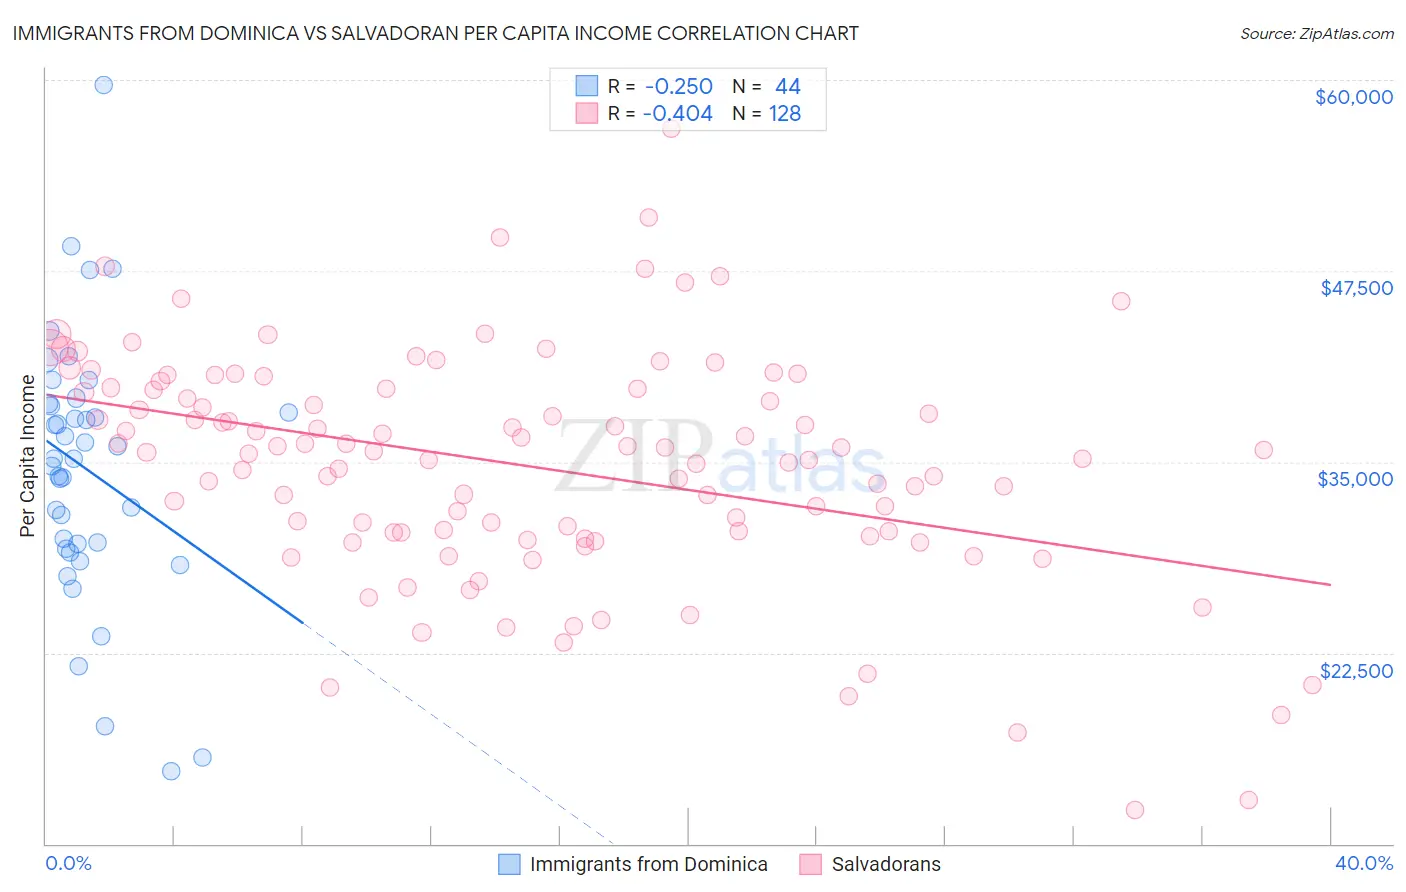
Immigrants from Dominica vs Salvadoran Per Capita Income Correlation Chart
The statistical analysis conducted on geographies consisting of 83,794,667 people shows a weak negative correlation between the proportion of Immigrants from Dominica and per capita income in the United States with a correlation coefficient (R) of -0.250 and weighted average of $37,952. Similarly, the statistical analysis conducted on geographies consisting of 399,090,197 people shows a moderate negative correlation between the proportion of Salvadorans and per capita income in the United States with a correlation coefficient (R) of -0.404 and weighted average of $38,858, a difference of 2.4%.
Per Capita Income Correlation Summary
| Measurement | Immigrants from Dominica | Salvadoran |
| Minimum | $14,729 | $12,183 |
| Maximum | $59,651 | $56,804 |
| Range | $44,922 | $44,621 |
| Mean | $34,508 | $34,754 |
| Median | $35,220 | $35,664 |
| Interquartile 25% (IQ1) | $29,494 | $30,375 |
| Interquartile 75% (IQ3) | $38,721 | $39,784 |
| Interquartile Range (IQR) | $9,227 | $9,409 |
| Standard Deviation (Sample) | $8,665 | $7,521 |
| Standard Deviation (Population) | $8,566 | $7,492 |
Demographics Similar to Immigrants from Dominica and Salvadorans by Per Capita Income
In terms of per capita income, the demographic groups most similar to Immigrants from Dominica are Colville ($38,047, a difference of 0.25%), Potawatomi ($38,046, a difference of 0.25%), Immigrants from Laos ($37,857, a difference of 0.25%), Pennsylvania German ($37,842, a difference of 0.29%), and Immigrants from Nicaragua ($38,065, a difference of 0.30%). Similarly, the demographic groups most similar to Salvadorans are Immigrants from Zaire ($38,848, a difference of 0.030%), Liberian ($38,780, a difference of 0.20%), Immigrants from Jamaica ($38,766, a difference of 0.24%), Spanish American ($39,012, a difference of 0.40%), and American ($39,039, a difference of 0.47%).
| Demographics | Rating | Rank | Per Capita Income |
| Belizeans | 0.6 /100 | #263 | Tragic $39,097 |
| Americans | 0.6 /100 | #264 | Tragic $39,039 |
| Spanish Americans | 0.5 /100 | #265 | Tragic $39,012 |
| Salvadorans | 0.5 /100 | #266 | Tragic $38,858 |
| Immigrants | Zaire | 0.4 /100 | #267 | Tragic $38,848 |
| Liberians | 0.4 /100 | #268 | Tragic $38,780 |
| Immigrants | Jamaica | 0.4 /100 | #269 | Tragic $38,766 |
| Immigrants | Belize | 0.3 /100 | #270 | Tragic $38,614 |
| Central Americans | 0.3 /100 | #271 | Tragic $38,560 |
| Immigrants | Cabo Verde | 0.3 /100 | #272 | Tragic $38,540 |
| Nepalese | 0.3 /100 | #273 | Tragic $38,442 |
| Immigrants | El Salvador | 0.3 /100 | #274 | Tragic $38,394 |
| Immigrants | Liberia | 0.2 /100 | #275 | Tragic $38,165 |
| Hmong | 0.2 /100 | #276 | Tragic $38,120 |
| Comanche | 0.2 /100 | #277 | Tragic $38,088 |
| Immigrants | Nicaragua | 0.2 /100 | #278 | Tragic $38,065 |
| Colville | 0.2 /100 | #279 | Tragic $38,047 |
| Potawatomi | 0.2 /100 | #280 | Tragic $38,046 |
| Immigrants | Dominica | 0.2 /100 | #281 | Tragic $37,952 |
| Immigrants | Laos | 0.1 /100 | #282 | Tragic $37,857 |
| Pennsylvania Germans | 0.1 /100 | #283 | Tragic $37,842 |