Immigrants from Ecuador vs German Russian Wage/Income Gap
COMPARE
Immigrants from Ecuador
German Russian
Wage/Income Gap
Wage/Income Gap Comparison
Immigrants from Ecuador
German Russians
22.5%
WAGE/INCOME GAP
100.0/ 100
METRIC RATING
63rd/ 347
METRIC RANK
24.6%
WAGE/INCOME GAP
93.7/ 100
METRIC RATING
127th/ 347
METRIC RANK
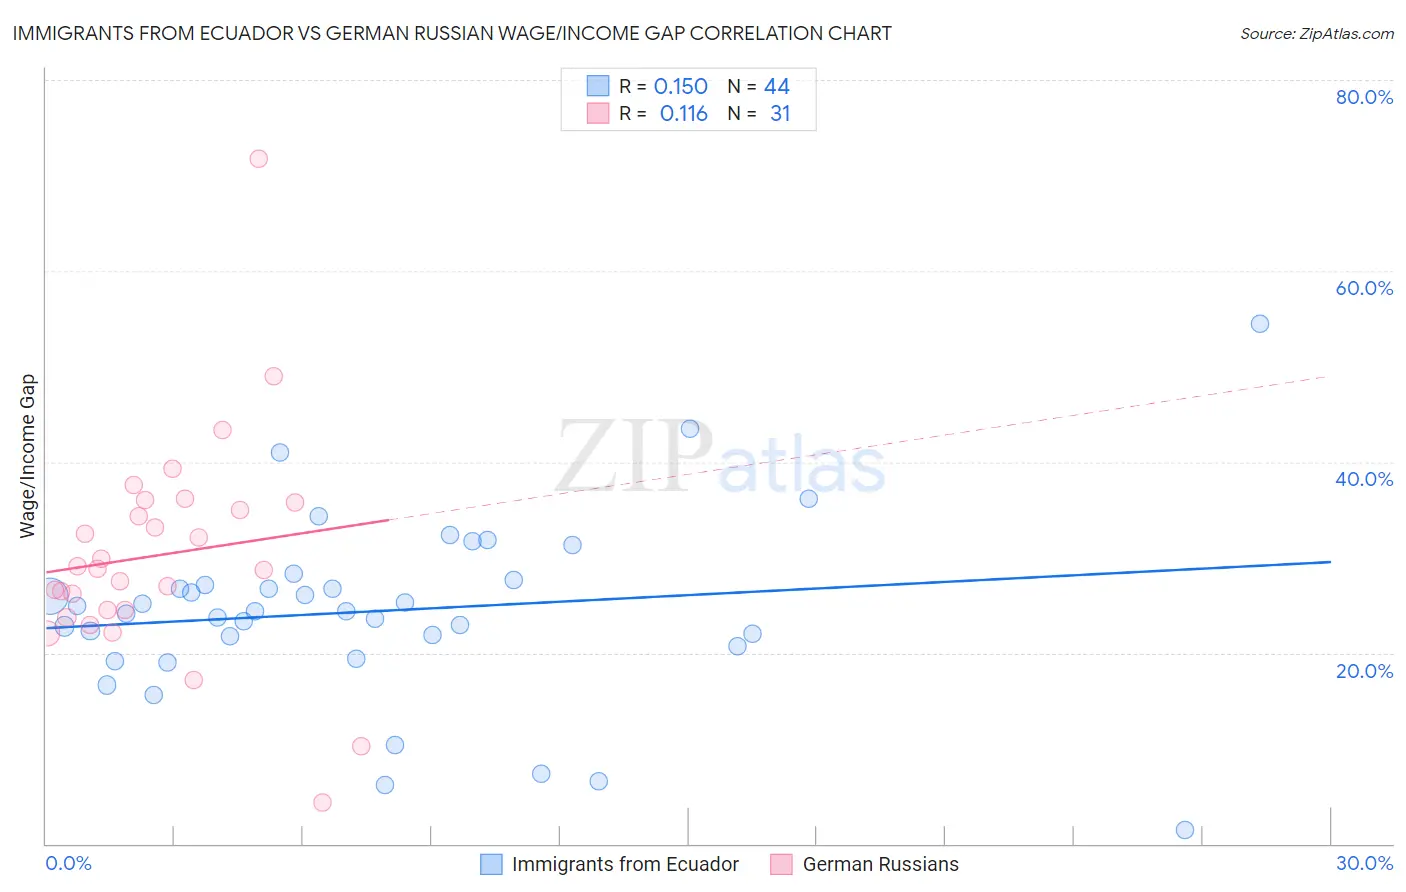
Immigrants from Ecuador vs German Russian Wage/Income Gap Correlation Chart
The statistical analysis conducted on geographies consisting of 270,894,682 people shows a poor positive correlation between the proportion of Immigrants from Ecuador and wage/income gap percentage in the United States with a correlation coefficient (R) of 0.150 and weighted average of 22.5%. Similarly, the statistical analysis conducted on geographies consisting of 96,446,629 people shows a poor positive correlation between the proportion of German Russians and wage/income gap percentage in the United States with a correlation coefficient (R) of 0.116 and weighted average of 24.6%, a difference of 9.6%.
Wage/Income Gap Correlation Summary
| Measurement | Immigrants from Ecuador | German Russian |
| Minimum | 1.4% | 4.3% |
| Maximum | 54.5% | 71.8% |
| Range | 53.1% | 67.5% |
| Mean | 24.4% | 30.2% |
| Median | 24.4% | 28.8% |
| Interquartile 25% (IQ1) | 21.2% | 24.4% |
| Interquartile 75% (IQ3) | 27.3% | 35.8% |
| Interquartile Range (IQR) | 6.1% | 11.3% |
| Standard Deviation (Sample) | 9.6% | 11.8% |
| Standard Deviation (Population) | 9.5% | 11.6% |
Similar Demographics by Wage/Income Gap
Demographics Similar to Immigrants from Ecuador by Wage/Income Gap
In terms of wage/income gap, the demographic groups most similar to Immigrants from Ecuador are Immigrants from Guatemala (22.5%, a difference of 0.14%), Spanish American Indian (22.5%, a difference of 0.29%), Immigrants from Fiji (22.4%, a difference of 0.35%), Immigrants from Middle Africa (22.4%, a difference of 0.52%), and Navajo (22.4%, a difference of 0.54%).
| Demographics | Rating | Rank | Wage/Income Gap |
| Immigrants | Ghana | 100.0 /100 | #56 | Exceptional 22.3% |
| Ghanaians | 100.0 /100 | #57 | Exceptional 22.3% |
| Immigrants | Cuba | 100.0 /100 | #58 | Exceptional 22.4% |
| Navajo | 100.0 /100 | #59 | Exceptional 22.4% |
| Immigrants | Middle Africa | 100.0 /100 | #60 | Exceptional 22.4% |
| Immigrants | Fiji | 100.0 /100 | #61 | Exceptional 22.4% |
| Immigrants | Guatemala | 100.0 /100 | #62 | Exceptional 22.5% |
| Immigrants | Ecuador | 100.0 /100 | #63 | Exceptional 22.5% |
| Spanish American Indians | 100.0 /100 | #64 | Exceptional 22.5% |
| Guatemalans | 99.9 /100 | #65 | Exceptional 22.6% |
| Central American Indians | 99.9 /100 | #66 | Exceptional 22.7% |
| Menominee | 99.9 /100 | #67 | Exceptional 22.7% |
| Immigrants | Nigeria | 99.9 /100 | #68 | Exceptional 22.7% |
| Indonesians | 99.9 /100 | #69 | Exceptional 22.7% |
| Immigrants | Uzbekistan | 99.9 /100 | #70 | Exceptional 22.7% |
Demographics Similar to German Russians by Wage/Income Gap
In terms of wage/income gap, the demographic groups most similar to German Russians are Immigrants from Uruguay (24.6%, a difference of 0.010%), Spanish American (24.6%, a difference of 0.020%), Immigrants from South America (24.6%, a difference of 0.050%), Immigrants from Central America (24.6%, a difference of 0.070%), and Yup'ik (24.7%, a difference of 0.12%).
| Demographics | Rating | Rank | Wage/Income Gap |
| Cree | 95.6 /100 | #120 | Exceptional 24.5% |
| Immigrants | Thailand | 94.9 /100 | #121 | Exceptional 24.5% |
| Apache | 94.8 /100 | #122 | Exceptional 24.5% |
| Natives/Alaskans | 94.6 /100 | #123 | Exceptional 24.6% |
| Immigrants | South America | 93.9 /100 | #124 | Exceptional 24.6% |
| Spanish Americans | 93.8 /100 | #125 | Exceptional 24.6% |
| Immigrants | Uruguay | 93.8 /100 | #126 | Exceptional 24.6% |
| German Russians | 93.7 /100 | #127 | Exceptional 24.6% |
| Immigrants | Central America | 93.5 /100 | #128 | Exceptional 24.6% |
| Yup'ik | 93.3 /100 | #129 | Exceptional 24.7% |
| Alsatians | 93.2 /100 | #130 | Exceptional 24.7% |
| Immigrants | Philippines | 93.0 /100 | #131 | Exceptional 24.7% |
| Immigrants | Costa Rica | 92.4 /100 | #132 | Exceptional 24.7% |
| Colombians | 92.4 /100 | #133 | Exceptional 24.7% |
| Mexican American Indians | 92.2 /100 | #134 | Exceptional 24.7% |