Immigrants from Eritrea vs Cheyenne Median Earnings
COMPARE
Immigrants from Eritrea
Cheyenne
Median Earnings
Median Earnings Comparison
Immigrants from Eritrea
Cheyenne
$47,657
MEDIAN EARNINGS
84.8/ 100
METRIC RATING
148th/ 347
METRIC RANK
$40,233
MEDIAN EARNINGS
0.0/ 100
METRIC RATING
314th/ 347
METRIC RANK
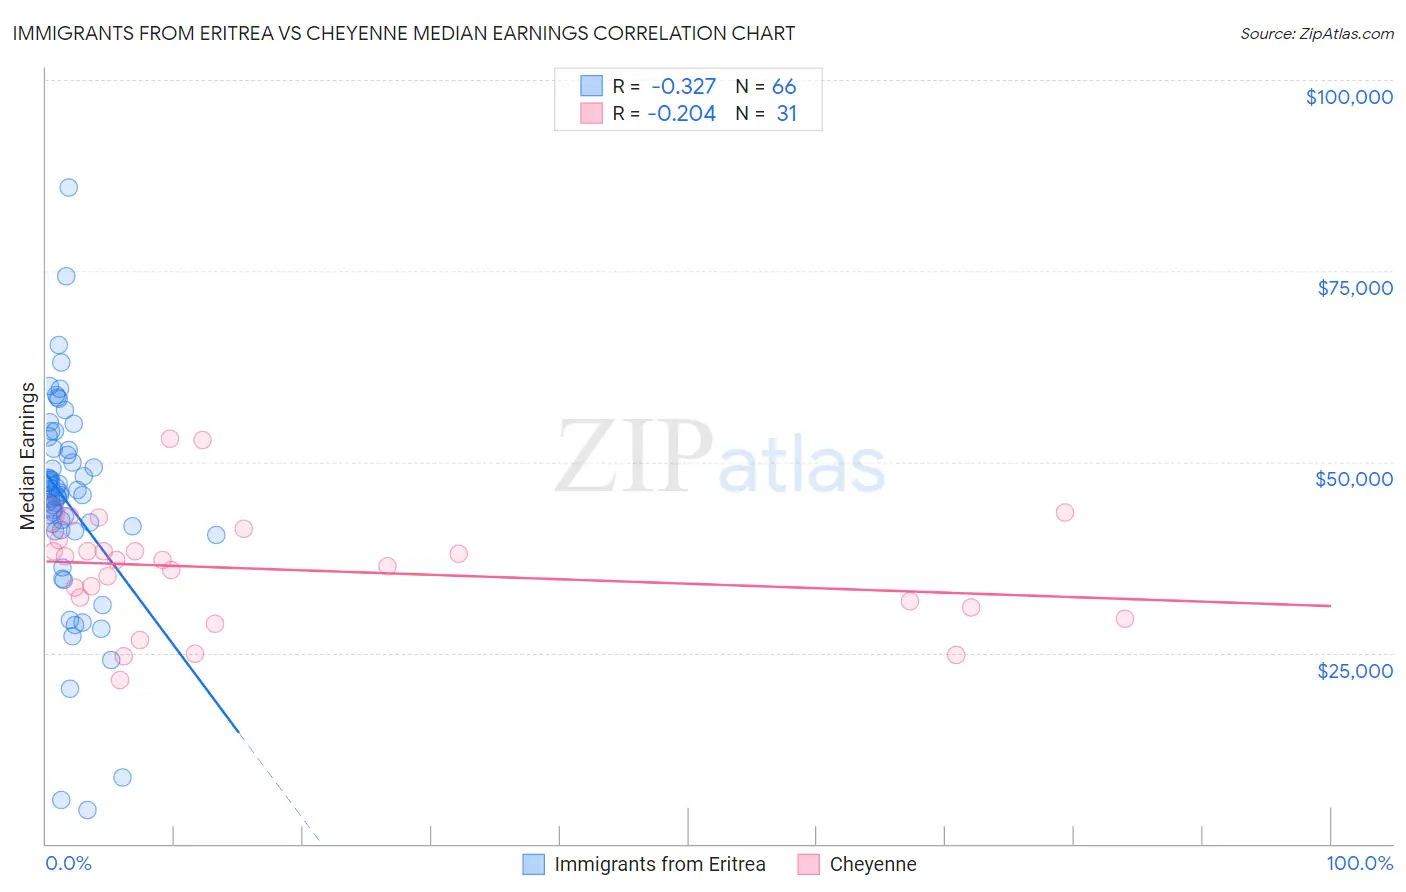
Immigrants from Eritrea vs Cheyenne Median Earnings Correlation Chart
The statistical analysis conducted on geographies consisting of 104,854,314 people shows a mild negative correlation between the proportion of Immigrants from Eritrea and median earnings in the United States with a correlation coefficient (R) of -0.327 and weighted average of $47,657. Similarly, the statistical analysis conducted on geographies consisting of 80,717,230 people shows a weak negative correlation between the proportion of Cheyenne and median earnings in the United States with a correlation coefficient (R) of -0.204 and weighted average of $40,233, a difference of 18.4%.
Median Earnings Correlation Summary
| Measurement | Immigrants from Eritrea | Cheyenne |
| Minimum | $4,426 | $21,433 |
| Maximum | $85,924 | $52,964 |
| Range | $81,498 | $31,531 |
| Mean | $44,557 | $35,877 |
| Median | $45,626 | $37,115 |
| Interquartile 25% (IQ1) | $40,964 | $31,011 |
| Interquartile 75% (IQ3) | $51,547 | $39,717 |
| Interquartile Range (IQR) | $10,583 | $8,706 |
| Standard Deviation (Sample) | $13,912 | $7,496 |
| Standard Deviation (Population) | $13,806 | $7,374 |
Similar Demographics by Median Earnings
Demographics Similar to Immigrants from Eritrea by Median Earnings
In terms of median earnings, the demographic groups most similar to Immigrants from Eritrea are Immigrants from South Eastern Asia ($47,671, a difference of 0.030%), Luxembourger ($47,640, a difference of 0.040%), Peruvian ($47,628, a difference of 0.060%), Immigrants from Chile ($47,697, a difference of 0.080%), and Immigrants from Oceania ($47,617, a difference of 0.080%).
| Demographics | Rating | Rank | Median Earnings |
| Immigrants | Sierra Leone | 88.3 /100 | #141 | Excellent $47,875 |
| Ugandans | 88.0 /100 | #142 | Excellent $47,854 |
| Swedes | 88.0 /100 | #143 | Excellent $47,851 |
| Hungarians | 87.1 /100 | #144 | Excellent $47,795 |
| Immigrants | Saudi Arabia | 85.6 /100 | #145 | Excellent $47,704 |
| Immigrants | Chile | 85.5 /100 | #146 | Excellent $47,697 |
| Immigrants | South Eastern Asia | 85.0 /100 | #147 | Excellent $47,671 |
| Immigrants | Eritrea | 84.8 /100 | #148 | Excellent $47,657 |
| Luxembourgers | 84.5 /100 | #149 | Excellent $47,640 |
| Peruvians | 84.2 /100 | #150 | Excellent $47,628 |
| Immigrants | Oceania | 84.1 /100 | #151 | Excellent $47,617 |
| Immigrants | Germany | 83.1 /100 | #152 | Excellent $47,566 |
| Slavs | 81.1 /100 | #153 | Excellent $47,470 |
| Immigrants | Portugal | 77.3 /100 | #154 | Good $47,304 |
| Immigrants | Vietnam | 76.7 /100 | #155 | Good $47,282 |
Demographics Similar to Cheyenne by Median Earnings
In terms of median earnings, the demographic groups most similar to Cheyenne are Seminole ($40,233, a difference of 0.0%), Choctaw ($40,270, a difference of 0.090%), Immigrants from Honduras ($40,195, a difference of 0.10%), Fijian ($40,193, a difference of 0.10%), and Chippewa ($40,287, a difference of 0.13%).
| Demographics | Rating | Rank | Median Earnings |
| Hondurans | 0.0 /100 | #307 | Tragic $40,638 |
| Cubans | 0.0 /100 | #308 | Tragic $40,619 |
| Immigrants | Haiti | 0.0 /100 | #309 | Tragic $40,550 |
| Apache | 0.0 /100 | #310 | Tragic $40,388 |
| Hispanics or Latinos | 0.0 /100 | #311 | Tragic $40,288 |
| Chippewa | 0.0 /100 | #312 | Tragic $40,287 |
| Choctaw | 0.0 /100 | #313 | Tragic $40,270 |
| Cheyenne | 0.0 /100 | #314 | Tragic $40,233 |
| Seminole | 0.0 /100 | #315 | Tragic $40,233 |
| Immigrants | Honduras | 0.0 /100 | #316 | Tragic $40,195 |
| Fijians | 0.0 /100 | #317 | Tragic $40,193 |
| Dutch West Indians | 0.0 /100 | #318 | Tragic $40,107 |
| Blacks/African Americans | 0.0 /100 | #319 | Tragic $40,085 |
| Immigrants | Bahamas | 0.0 /100 | #320 | Tragic $39,861 |
| Mexicans | 0.0 /100 | #321 | Tragic $39,834 |