Immigrants from France vs Arapaho Wage/Income Gap
COMPARE
Immigrants from France
Arapaho
Wage/Income Gap
Wage/Income Gap Comparison
Immigrants from France
Arapaho
27.4%
WAGE/INCOME GAP
2.1/ 100
METRIC RATING
255th/ 347
METRIC RANK
23.5%
WAGE/INCOME GAP
99.6/ 100
METRIC RATING
91st/ 347
METRIC RANK
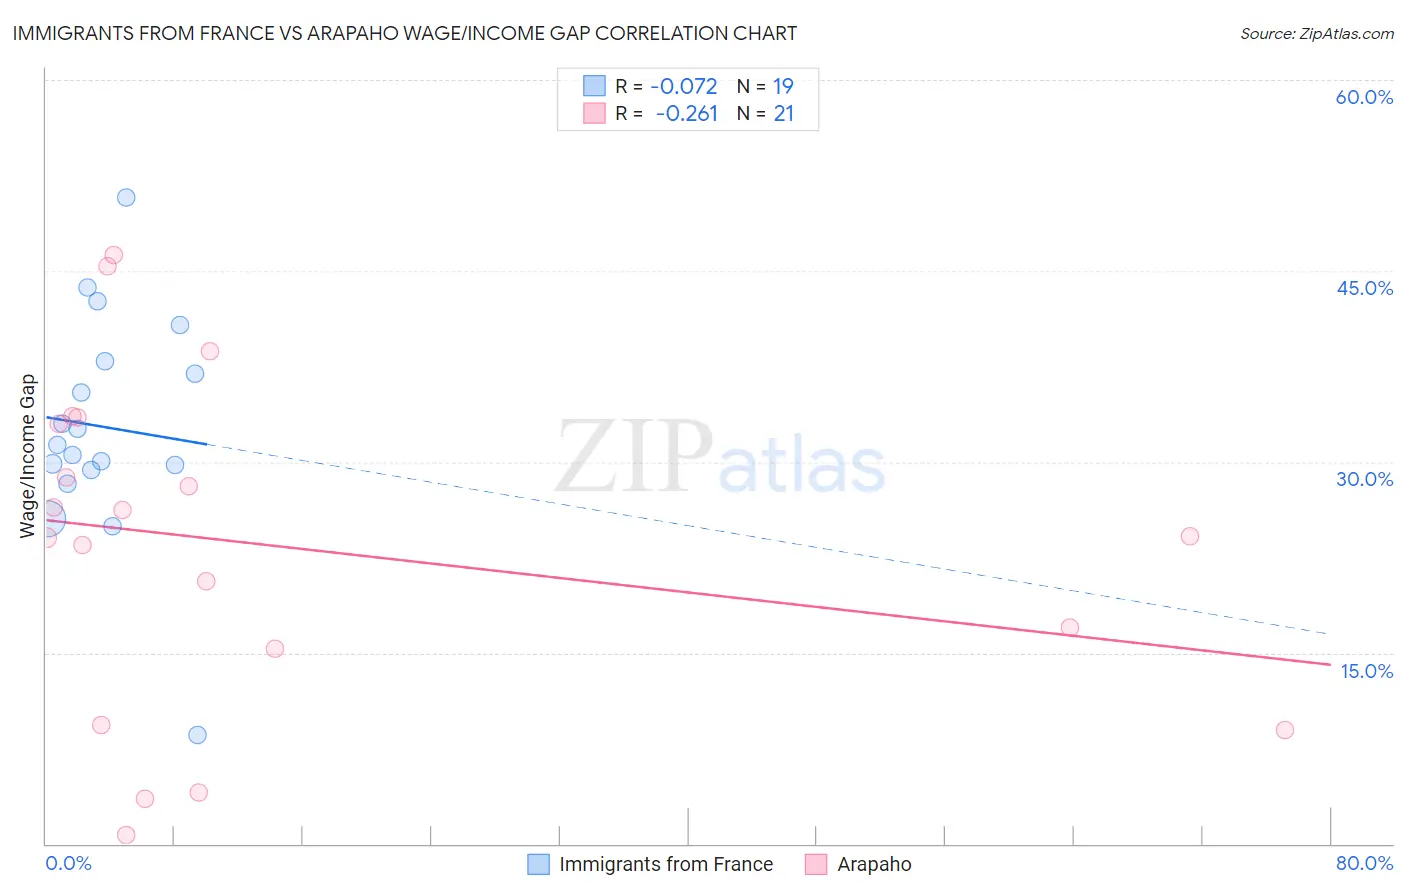
Immigrants from France vs Arapaho Wage/Income Gap Correlation Chart
The statistical analysis conducted on geographies consisting of 287,766,444 people shows a slight negative correlation between the proportion of Immigrants from France and wage/income gap percentage in the United States with a correlation coefficient (R) of -0.072 and weighted average of 27.4%. Similarly, the statistical analysis conducted on geographies consisting of 29,769,339 people shows a weak negative correlation between the proportion of Arapaho and wage/income gap percentage in the United States with a correlation coefficient (R) of -0.261 and weighted average of 23.5%, a difference of 16.7%.
Wage/Income Gap Correlation Summary
| Measurement | Immigrants from France | Arapaho |
| Minimum | 8.5% | 0.71% |
| Maximum | 50.8% | 46.3% |
| Range | 42.2% | 45.6% |
| Mean | 32.7% | 23.4% |
| Median | 31.3% | 24.1% |
| Interquartile 25% (IQ1) | 29.3% | 12.3% |
| Interquartile 75% (IQ3) | 37.9% | 33.3% |
| Interquartile Range (IQR) | 8.6% | 20.9% |
| Standard Deviation (Sample) | 8.9% | 13.1% |
| Standard Deviation (Population) | 8.6% | 12.8% |
Similar Demographics by Wage/Income Gap
Demographics Similar to Immigrants from France by Wage/Income Gap
In terms of wage/income gap, the demographic groups most similar to Immigrants from France are Israeli (27.4%, a difference of 0.010%), Portuguese (27.4%, a difference of 0.090%), Cherokee (27.4%, a difference of 0.10%), Luxembourger (27.4%, a difference of 0.15%), and Slavic (27.4%, a difference of 0.19%).
| Demographics | Rating | Rank | Wage/Income Gap |
| Cypriots | 2.8 /100 | #248 | Tragic 27.3% |
| Carpatho Rusyns | 2.7 /100 | #249 | Tragic 27.3% |
| Immigrants | Czechoslovakia | 2.7 /100 | #250 | Tragic 27.3% |
| Immigrants | Norway | 2.5 /100 | #251 | Tragic 27.3% |
| Ukrainians | 2.4 /100 | #252 | Tragic 27.3% |
| Portuguese | 2.2 /100 | #253 | Tragic 27.4% |
| Israelis | 2.1 /100 | #254 | Tragic 27.4% |
| Immigrants | France | 2.1 /100 | #255 | Tragic 27.4% |
| Cherokee | 1.9 /100 | #256 | Tragic 27.4% |
| Luxembourgers | 1.9 /100 | #257 | Tragic 27.4% |
| Slavs | 1.8 /100 | #258 | Tragic 27.4% |
| Icelanders | 1.8 /100 | #259 | Tragic 27.5% |
| Tongans | 1.7 /100 | #260 | Tragic 27.5% |
| Immigrants | Germany | 1.5 /100 | #261 | Tragic 27.5% |
| Immigrants | Lebanon | 1.5 /100 | #262 | Tragic 27.5% |
Demographics Similar to Arapaho by Wage/Income Gap
In terms of wage/income gap, the demographic groups most similar to Arapaho are Nicaraguan (23.4%, a difference of 0.14%), Marshallese (23.4%, a difference of 0.15%), Immigrants from Honduras (23.5%, a difference of 0.15%), Immigrants from Panama (23.4%, a difference of 0.24%), and Immigrants from Cabo Verde (23.6%, a difference of 0.39%).
| Demographics | Rating | Rank | Wage/Income Gap |
| Cubans | 99.7 /100 | #84 | Exceptional 23.3% |
| Immigrants | Cambodia | 99.7 /100 | #85 | Exceptional 23.3% |
| Cheyenne | 99.7 /100 | #86 | Exceptional 23.3% |
| Yuman | 99.7 /100 | #87 | Exceptional 23.3% |
| Immigrants | Panama | 99.6 /100 | #88 | Exceptional 23.4% |
| Marshallese | 99.6 /100 | #89 | Exceptional 23.4% |
| Nicaraguans | 99.6 /100 | #90 | Exceptional 23.4% |
| Arapaho | 99.6 /100 | #91 | Exceptional 23.5% |
| Immigrants | Honduras | 99.5 /100 | #92 | Exceptional 23.5% |
| Immigrants | Cabo Verde | 99.5 /100 | #93 | Exceptional 23.6% |
| Hondurans | 99.5 /100 | #94 | Exceptional 23.6% |
| Cape Verdeans | 99.4 /100 | #95 | Exceptional 23.6% |
| Kiowa | 99.4 /100 | #96 | Exceptional 23.6% |
| Immigrants | Sudan | 99.4 /100 | #97 | Exceptional 23.6% |
| Immigrants | Latin America | 99.2 /100 | #98 | Exceptional 23.7% |