Immigrants from Greece vs Latvian Median Female Earnings
COMPARE
Immigrants from Greece
Latvian
Median Female Earnings
Median Female Earnings Comparison
Immigrants from Greece
Latvians
$44,976
MEDIAN FEMALE EARNINGS
100.0/ 100
METRIC RATING
22nd/ 347
METRIC RANK
$43,941
MEDIAN FEMALE EARNINGS
100.0/ 100
METRIC RATING
38th/ 347
METRIC RANK
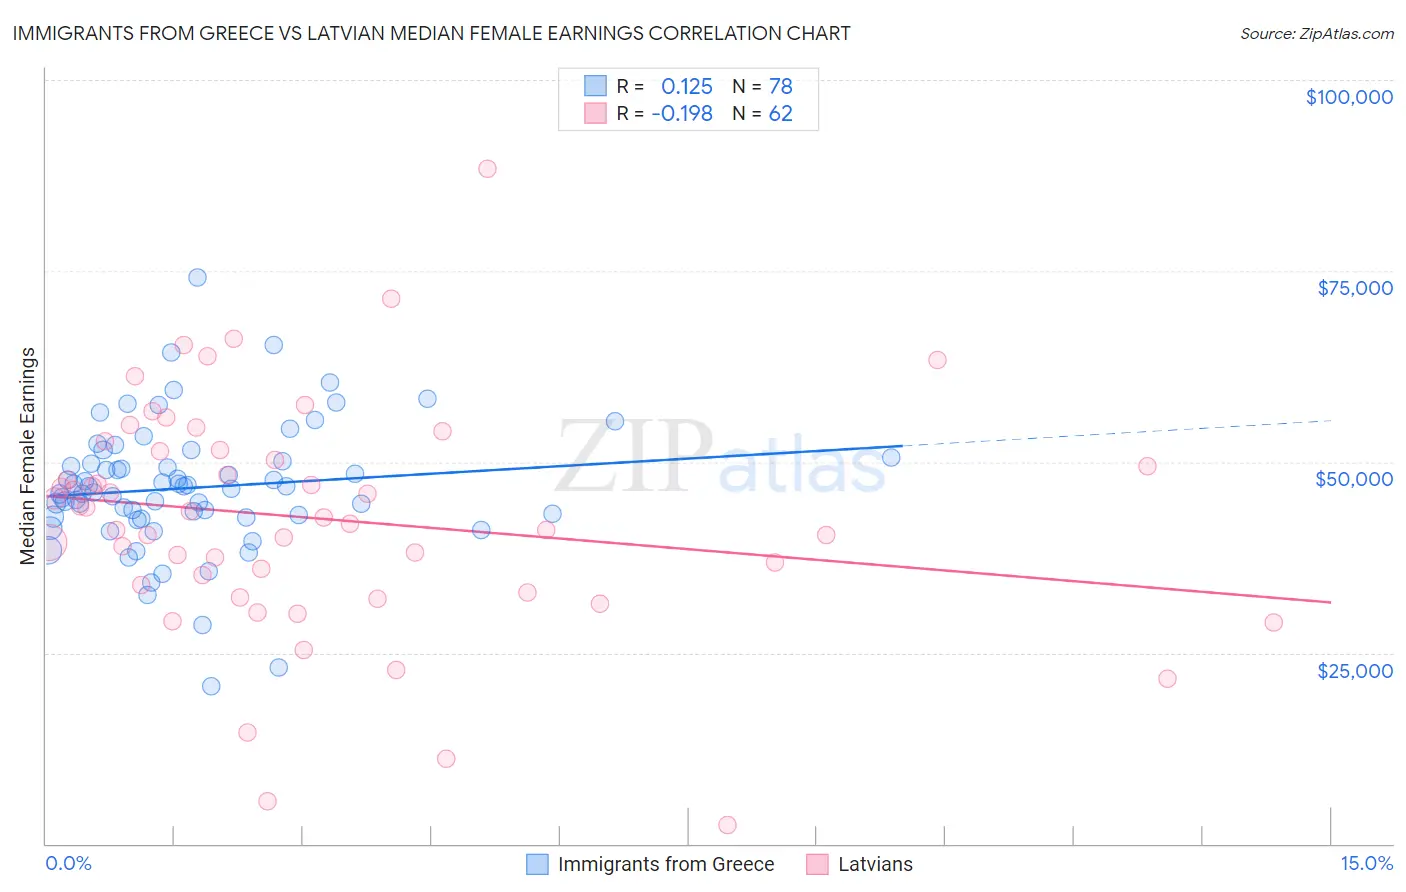
Immigrants from Greece vs Latvian Median Female Earnings Correlation Chart
The statistical analysis conducted on geographies consisting of 216,834,744 people shows a poor positive correlation between the proportion of Immigrants from Greece and median female earnings in the United States with a correlation coefficient (R) of 0.125 and weighted average of $44,976. Similarly, the statistical analysis conducted on geographies consisting of 220,706,355 people shows a poor negative correlation between the proportion of Latvians and median female earnings in the United States with a correlation coefficient (R) of -0.198 and weighted average of $43,941, a difference of 2.4%.
Median Female Earnings Correlation Summary
| Measurement | Immigrants from Greece | Latvian |
| Minimum | $20,568 | $2,499 |
| Maximum | $74,175 | $88,365 |
| Range | $53,607 | $85,866 |
| Mean | $46,608 | $42,555 |
| Median | $46,610 | $43,118 |
| Interquartile 25% (IQ1) | $42,848 | $33,868 |
| Interquartile 75% (IQ3) | $50,040 | $51,451 |
| Interquartile Range (IQR) | $7,192 | $17,583 |
| Standard Deviation (Sample) | $8,519 | $15,211 |
| Standard Deviation (Population) | $8,464 | $15,087 |
Demographics Similar to Immigrants from Greece and Latvians by Median Female Earnings
In terms of median female earnings, the demographic groups most similar to Immigrants from Greece are Cambodian ($45,014, a difference of 0.080%), Burmese ($44,911, a difference of 0.14%), Immigrants from Korea ($44,847, a difference of 0.29%), Immigrants from Sweden ($44,774, a difference of 0.45%), and Immigrants from Belarus ($44,757, a difference of 0.49%). Similarly, the demographic groups most similar to Latvians are Immigrants from Switzerland ($43,996, a difference of 0.12%), Israeli ($43,852, a difference of 0.20%), Immigrants from Malaysia ($43,835, a difference of 0.24%), Immigrants from Turkey ($44,066, a difference of 0.28%), and Immigrants from Sri Lanka ($44,161, a difference of 0.50%).
| Demographics | Rating | Rank | Median Female Earnings |
| Immigrants | Japan | 100.0 /100 | #20 | Exceptional $45,323 |
| Cambodians | 100.0 /100 | #21 | Exceptional $45,014 |
| Immigrants | Greece | 100.0 /100 | #22 | Exceptional $44,976 |
| Burmese | 100.0 /100 | #23 | Exceptional $44,911 |
| Immigrants | Korea | 100.0 /100 | #24 | Exceptional $44,847 |
| Immigrants | Sweden | 100.0 /100 | #25 | Exceptional $44,774 |
| Immigrants | Belarus | 100.0 /100 | #26 | Exceptional $44,757 |
| Turks | 100.0 /100 | #27 | Exceptional $44,695 |
| Immigrants | Russia | 100.0 /100 | #28 | Exceptional $44,680 |
| Immigrants | Belgium | 100.0 /100 | #29 | Exceptional $44,587 |
| Asians | 100.0 /100 | #30 | Exceptional $44,586 |
| Immigrants | France | 100.0 /100 | #31 | Exceptional $44,541 |
| Immigrants | Northern Europe | 100.0 /100 | #32 | Exceptional $44,366 |
| Immigrants | Asia | 100.0 /100 | #33 | Exceptional $44,198 |
| Russians | 100.0 /100 | #34 | Exceptional $44,169 |
| Immigrants | Sri Lanka | 100.0 /100 | #35 | Exceptional $44,161 |
| Immigrants | Turkey | 100.0 /100 | #36 | Exceptional $44,066 |
| Immigrants | Switzerland | 100.0 /100 | #37 | Exceptional $43,996 |
| Latvians | 100.0 /100 | #38 | Exceptional $43,941 |
| Israelis | 100.0 /100 | #39 | Exceptional $43,852 |
| Immigrants | Malaysia | 100.0 /100 | #40 | Exceptional $43,835 |