Immigrants from Guatemala vs Immigrants from Romania Per Capita Income
COMPARE
Immigrants from Guatemala
Immigrants from Romania
Per Capita Income
Per Capita Income Comparison
Immigrants from Guatemala
Immigrants from Romania
$37,550
PER CAPITA INCOME
0.1/ 100
METRIC RATING
290th/ 347
METRIC RANK
$49,463
PER CAPITA INCOME
99.9/ 100
METRIC RATING
67th/ 347
METRIC RANK
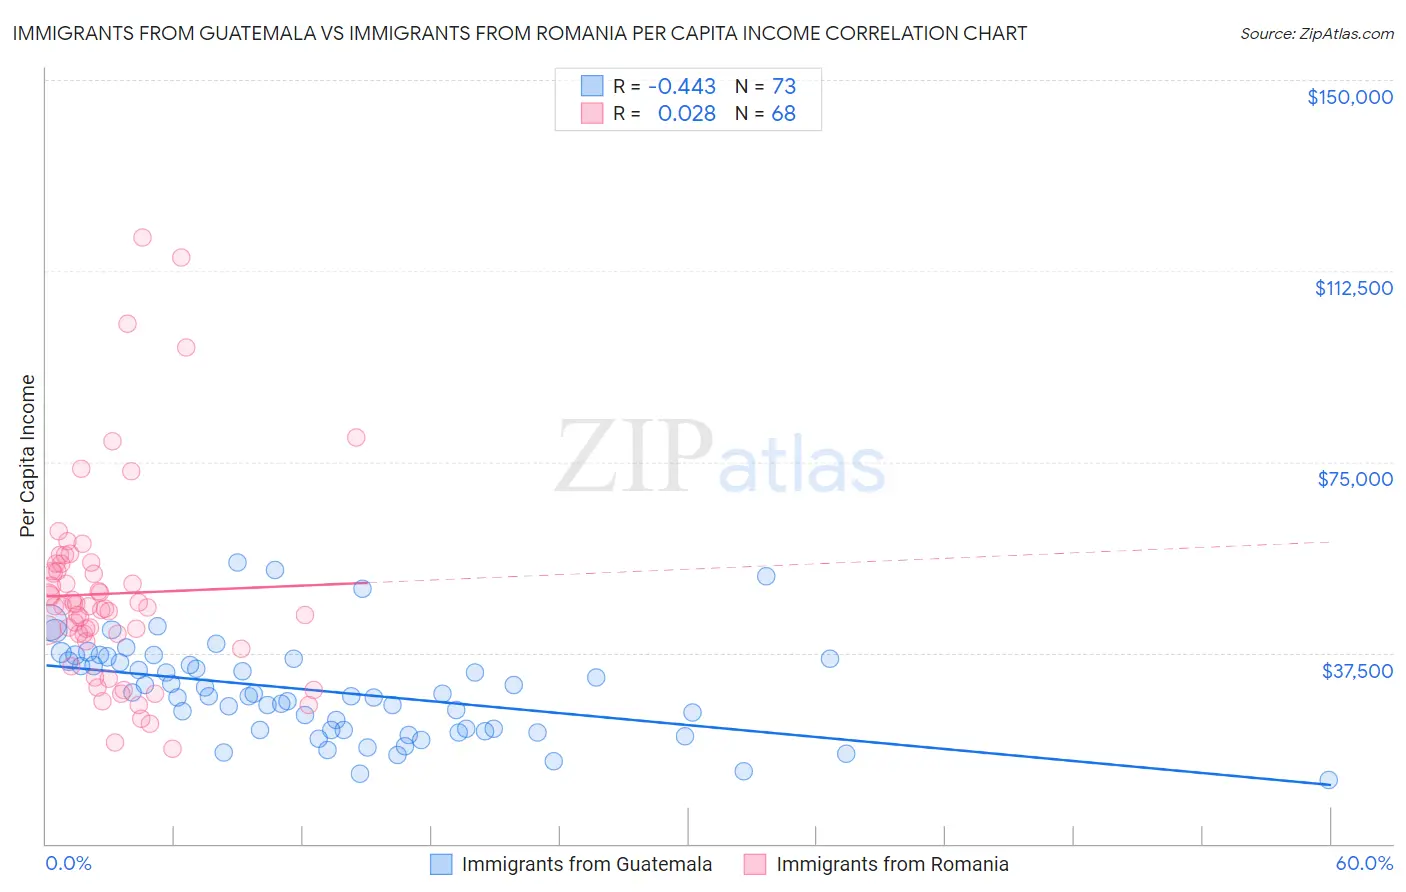
Immigrants from Guatemala vs Immigrants from Romania Per Capita Income Correlation Chart
The statistical analysis conducted on geographies consisting of 377,292,357 people shows a moderate negative correlation between the proportion of Immigrants from Guatemala and per capita income in the United States with a correlation coefficient (R) of -0.443 and weighted average of $37,550. Similarly, the statistical analysis conducted on geographies consisting of 256,972,544 people shows no correlation between the proportion of Immigrants from Romania and per capita income in the United States with a correlation coefficient (R) of 0.028 and weighted average of $49,463, a difference of 31.7%.
Per Capita Income Correlation Summary
| Measurement | Immigrants from Guatemala | Immigrants from Romania |
| Minimum | $12,606 | $18,731 |
| Maximum | $55,157 | $119,092 |
| Range | $42,551 | $100,361 |
| Mean | $29,919 | $49,122 |
| Median | $29,061 | $46,712 |
| Interquartile 25% (IQ1) | $22,369 | $40,435 |
| Interquartile 75% (IQ3) | $36,058 | $54,228 |
| Interquartile Range (IQR) | $13,690 | $13,794 |
| Standard Deviation (Sample) | $9,360 | $19,681 |
| Standard Deviation (Population) | $9,296 | $19,535 |
Similar Demographics by Per Capita Income
Demographics Similar to Immigrants from Guatemala by Per Capita Income
In terms of per capita income, the demographic groups most similar to Immigrants from Guatemala are Cajun ($37,527, a difference of 0.060%), U.S. Virgin Islander ($37,589, a difference of 0.10%), Immigrants from Micronesia ($37,464, a difference of 0.23%), Mexican American Indian ($37,407, a difference of 0.38%), and Dominican ($37,697, a difference of 0.39%).
| Demographics | Rating | Rank | Per Capita Income |
| Pennsylvania Germans | 0.1 /100 | #283 | Tragic $37,842 |
| Africans | 0.1 /100 | #284 | Tragic $37,785 |
| Guatemalans | 0.1 /100 | #285 | Tragic $37,766 |
| Central American Indians | 0.1 /100 | #286 | Tragic $37,699 |
| Dominicans | 0.1 /100 | #287 | Tragic $37,697 |
| Blackfeet | 0.1 /100 | #288 | Tragic $37,695 |
| U.S. Virgin Islanders | 0.1 /100 | #289 | Tragic $37,589 |
| Immigrants | Guatemala | 0.1 /100 | #290 | Tragic $37,550 |
| Cajuns | 0.1 /100 | #291 | Tragic $37,527 |
| Immigrants | Micronesia | 0.1 /100 | #292 | Tragic $37,464 |
| Mexican American Indians | 0.1 /100 | #293 | Tragic $37,407 |
| Cubans | 0.1 /100 | #294 | Tragic $37,383 |
| Immigrants | Dominican Republic | 0.1 /100 | #295 | Tragic $37,306 |
| Indonesians | 0.1 /100 | #296 | Tragic $37,300 |
| Haitians | 0.1 /100 | #297 | Tragic $37,289 |
Demographics Similar to Immigrants from Romania by Per Capita Income
In terms of per capita income, the demographic groups most similar to Immigrants from Romania are Lithuanian ($49,448, a difference of 0.030%), Immigrants from Bulgaria ($49,482, a difference of 0.040%), Immigrants from Canada ($49,412, a difference of 0.10%), Bolivian ($49,526, a difference of 0.13%), and Immigrants from Eastern Europe ($49,316, a difference of 0.30%).
| Demographics | Rating | Rank | Per Capita Income |
| Immigrants | Scotland | 99.9 /100 | #60 | Exceptional $49,893 |
| Argentineans | 99.9 /100 | #61 | Exceptional $49,862 |
| Immigrants | Asia | 99.9 /100 | #62 | Exceptional $49,741 |
| Maltese | 99.9 /100 | #63 | Exceptional $49,640 |
| Immigrants | Argentina | 99.9 /100 | #64 | Exceptional $49,627 |
| Bolivians | 99.9 /100 | #65 | Exceptional $49,526 |
| Immigrants | Bulgaria | 99.9 /100 | #66 | Exceptional $49,482 |
| Immigrants | Romania | 99.9 /100 | #67 | Exceptional $49,463 |
| Lithuanians | 99.8 /100 | #68 | Exceptional $49,448 |
| Immigrants | Canada | 99.8 /100 | #69 | Exceptional $49,412 |
| Immigrants | Eastern Europe | 99.8 /100 | #70 | Exceptional $49,316 |
| Greeks | 99.8 /100 | #71 | Exceptional $49,309 |
| Immigrants | Hungary | 99.8 /100 | #72 | Exceptional $49,303 |
| Immigrants | North America | 99.8 /100 | #73 | Exceptional $49,302 |
| Mongolians | 99.8 /100 | #74 | Exceptional $49,173 |