Immigrants from India vs Chinese Median Female Earnings
COMPARE
Immigrants from India
Chinese
Median Female Earnings
Median Female Earnings Comparison
Immigrants from India
Chinese
$48,292
MEDIAN FEMALE EARNINGS
100.0/ 100
METRIC RATING
4th/ 347
METRIC RANK
$41,461
MEDIAN FEMALE EARNINGS
97.5/ 100
METRIC RATING
109th/ 347
METRIC RANK
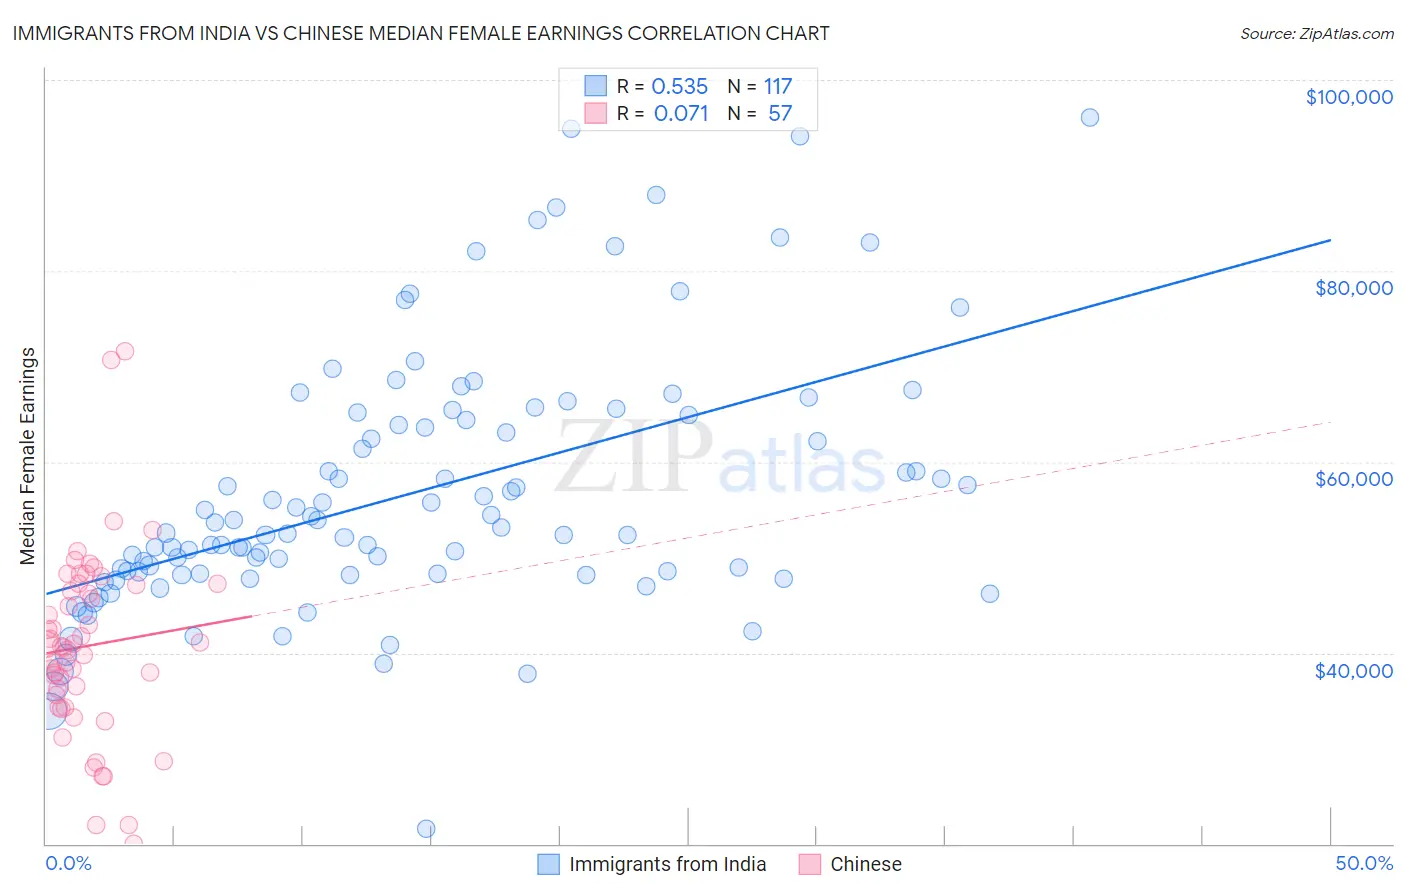
Immigrants from India vs Chinese Median Female Earnings Correlation Chart
The statistical analysis conducted on geographies consisting of 433,961,093 people shows a substantial positive correlation between the proportion of Immigrants from India and median female earnings in the United States with a correlation coefficient (R) of 0.535 and weighted average of $48,292. Similarly, the statistical analysis conducted on geographies consisting of 64,808,152 people shows a slight positive correlation between the proportion of Chinese and median female earnings in the United States with a correlation coefficient (R) of 0.071 and weighted average of $41,461, a difference of 16.5%.
Median Female Earnings Correlation Summary
| Measurement | Immigrants from India | Chinese |
| Minimum | $21,591 | $20,043 |
| Maximum | $96,063 | $71,591 |
| Range | $74,472 | $51,548 |
| Mean | $56,646 | $40,727 |
| Median | $52,549 | $40,673 |
| Interquartile 25% (IQ1) | $48,205 | $34,915 |
| Interquartile 75% (IQ3) | $64,667 | $47,174 |
| Interquartile Range (IQR) | $16,462 | $12,258 |
| Standard Deviation (Sample) | $13,523 | $9,803 |
| Standard Deviation (Population) | $13,465 | $9,716 |
Similar Demographics by Median Female Earnings
Demographics Similar to Immigrants from India by Median Female Earnings
In terms of median female earnings, the demographic groups most similar to Immigrants from India are Immigrants from Singapore ($47,986, a difference of 0.64%), Immigrants from Ireland ($47,598, a difference of 1.5%), Thai ($47,577, a difference of 1.5%), Iranian ($47,421, a difference of 1.8%), and Immigrants from Taiwan ($49,256, a difference of 2.0%).
| Demographics | Rating | Rank | Median Female Earnings |
| Immigrants | Hong Kong | 100.0 /100 | #1 | Exceptional $49,818 |
| Filipinos | 100.0 /100 | #2 | Exceptional $49,508 |
| Immigrants | Taiwan | 100.0 /100 | #3 | Exceptional $49,256 |
| Immigrants | India | 100.0 /100 | #4 | Exceptional $48,292 |
| Immigrants | Singapore | 100.0 /100 | #5 | Exceptional $47,986 |
| Immigrants | Ireland | 100.0 /100 | #6 | Exceptional $47,598 |
| Thais | 100.0 /100 | #7 | Exceptional $47,577 |
| Iranians | 100.0 /100 | #8 | Exceptional $47,421 |
| Immigrants | Iran | 100.0 /100 | #9 | Exceptional $47,154 |
| Immigrants | China | 100.0 /100 | #10 | Exceptional $46,972 |
| Okinawans | 100.0 /100 | #11 | Exceptional $46,905 |
| Immigrants | Israel | 100.0 /100 | #12 | Exceptional $46,902 |
| Immigrants | Australia | 100.0 /100 | #13 | Exceptional $46,573 |
| Soviet Union | 100.0 /100 | #14 | Exceptional $46,556 |
| Immigrants | Eastern Asia | 100.0 /100 | #15 | Exceptional $46,502 |
Demographics Similar to Chinese by Median Female Earnings
In terms of median female earnings, the demographic groups most similar to Chinese are Jordanian ($41,464, a difference of 0.010%), Palestinian ($41,484, a difference of 0.050%), Immigrants from Eritrea ($41,485, a difference of 0.060%), Italian ($41,505, a difference of 0.10%), and Immigrants from Zimbabwe ($41,527, a difference of 0.16%).
| Demographics | Rating | Rank | Median Female Earnings |
| Immigrants | Poland | 98.2 /100 | #102 | Exceptional $41,630 |
| Immigrants | Argentina | 97.9 /100 | #103 | Exceptional $41,554 |
| Immigrants | Zimbabwe | 97.8 /100 | #104 | Exceptional $41,527 |
| Italians | 97.7 /100 | #105 | Exceptional $41,505 |
| Immigrants | Eritrea | 97.6 /100 | #106 | Exceptional $41,485 |
| Palestinians | 97.6 /100 | #107 | Exceptional $41,484 |
| Jordanians | 97.5 /100 | #108 | Exceptional $41,464 |
| Chinese | 97.5 /100 | #109 | Exceptional $41,461 |
| Immigrants | Western Asia | 97.0 /100 | #110 | Exceptional $41,375 |
| Immigrants | Canada | 97.0 /100 | #111 | Exceptional $41,373 |
| Immigrants | North America | 96.7 /100 | #112 | Exceptional $41,319 |
| Macedonians | 96.4 /100 | #113 | Exceptional $41,286 |
| Immigrants | England | 96.4 /100 | #114 | Exceptional $41,277 |
| Koreans | 96.4 /100 | #115 | Exceptional $41,276 |
| Immigrants | Brazil | 96.4 /100 | #116 | Exceptional $41,273 |