Immigrants from Iraq vs Immigrants from Sweden Median Male Earnings
COMPARE
Immigrants from Iraq
Immigrants from Sweden
Median Male Earnings
Median Male Earnings Comparison
Immigrants from Iraq
Immigrants from Sweden
$52,681
MEDIAN MALE EARNINGS
14.5/ 100
METRIC RATING
206th/ 347
METRIC RANK
$65,406
MEDIAN MALE EARNINGS
100.0/ 100
METRIC RATING
21st/ 347
METRIC RANK
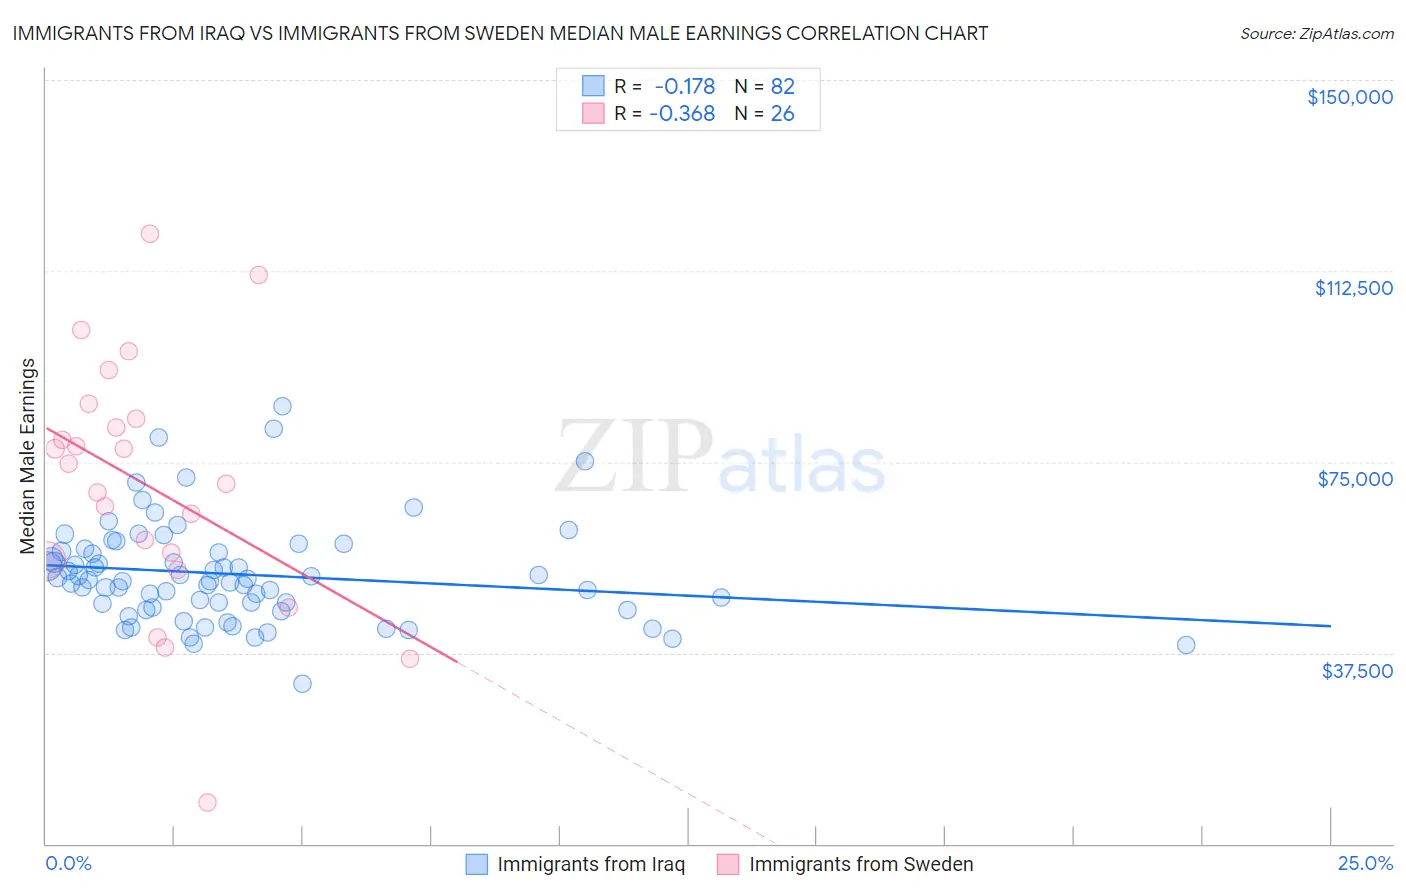
Immigrants from Iraq vs Immigrants from Sweden Median Male Earnings Correlation Chart
The statistical analysis conducted on geographies consisting of 194,755,120 people shows a poor negative correlation between the proportion of Immigrants from Iraq and median male earnings in the United States with a correlation coefficient (R) of -0.178 and weighted average of $52,681. Similarly, the statistical analysis conducted on geographies consisting of 164,719,286 people shows a mild negative correlation between the proportion of Immigrants from Sweden and median male earnings in the United States with a correlation coefficient (R) of -0.368 and weighted average of $65,406, a difference of 24.2%.
Median Male Earnings Correlation Summary
| Measurement | Immigrants from Iraq | Immigrants from Sweden |
| Minimum | $31,325 | $8,107 |
| Maximum | $85,833 | $119,732 |
| Range | $54,508 | $111,625 |
| Mean | $52,958 | $70,306 |
| Median | $51,715 | $72,770 |
| Interquartile 25% (IQ1) | $46,434 | $55,777 |
| Interquartile 75% (IQ3) | $57,443 | $83,429 |
| Interquartile Range (IQR) | $11,008 | $27,652 |
| Standard Deviation (Sample) | $9,945 | $24,867 |
| Standard Deviation (Population) | $9,884 | $24,384 |
Similar Demographics by Median Male Earnings
Demographics Similar to Immigrants from Iraq by Median Male Earnings
In terms of median male earnings, the demographic groups most similar to Immigrants from Iraq are Immigrants from Colombia ($52,725, a difference of 0.080%), Ghanaian ($52,810, a difference of 0.24%), Panamanian ($52,835, a difference of 0.29%), Vietnamese ($52,525, a difference of 0.30%), and Venezuelan ($52,510, a difference of 0.33%).
| Demographics | Rating | Rank | Median Male Earnings |
| Tongans | 22.3 /100 | #199 | Fair $53,218 |
| Immigrants | Thailand | 17.5 /100 | #200 | Poor $52,908 |
| Immigrants | Bosnia and Herzegovina | 16.9 /100 | #201 | Poor $52,869 |
| Immigrants | Uruguay | 16.8 /100 | #202 | Poor $52,860 |
| Panamanians | 16.5 /100 | #203 | Poor $52,835 |
| Ghanaians | 16.1 /100 | #204 | Poor $52,810 |
| Immigrants | Colombia | 15.0 /100 | #205 | Poor $52,725 |
| Immigrants | Iraq | 14.5 /100 | #206 | Poor $52,681 |
| Vietnamese | 12.7 /100 | #207 | Poor $52,525 |
| Venezuelans | 12.5 /100 | #208 | Poor $52,510 |
| Bermudans | 12.1 /100 | #209 | Poor $52,465 |
| Delaware | 11.5 /100 | #210 | Poor $52,412 |
| Tlingit-Haida | 11.5 /100 | #211 | Poor $52,409 |
| Cajuns | 10.7 /100 | #212 | Poor $52,325 |
| Native Hawaiians | 10.5 /100 | #213 | Poor $52,306 |
Demographics Similar to Immigrants from Sweden by Median Male Earnings
In terms of median male earnings, the demographic groups most similar to Immigrants from Sweden are Immigrants from Japan ($65,518, a difference of 0.17%), Cypriot ($65,549, a difference of 0.22%), Burmese ($65,236, a difference of 0.26%), Immigrants from Korea ($65,079, a difference of 0.50%), and Immigrants from Northern Europe ($64,987, a difference of 0.65%).
| Demographics | Rating | Rank | Median Male Earnings |
| Okinawans | 100.0 /100 | #14 | Exceptional $67,232 |
| Immigrants | Eastern Asia | 100.0 /100 | #15 | Exceptional $66,903 |
| Eastern Europeans | 100.0 /100 | #16 | Exceptional $66,472 |
| Immigrants | Belgium | 100.0 /100 | #17 | Exceptional $66,125 |
| Indians (Asian) | 100.0 /100 | #18 | Exceptional $66,078 |
| Cypriots | 100.0 /100 | #19 | Exceptional $65,549 |
| Immigrants | Japan | 100.0 /100 | #20 | Exceptional $65,518 |
| Immigrants | Sweden | 100.0 /100 | #21 | Exceptional $65,406 |
| Burmese | 100.0 /100 | #22 | Exceptional $65,236 |
| Immigrants | Korea | 100.0 /100 | #23 | Exceptional $65,079 |
| Immigrants | Northern Europe | 100.0 /100 | #24 | Exceptional $64,987 |
| Immigrants | Denmark | 100.0 /100 | #25 | Exceptional $64,625 |
| Turks | 100.0 /100 | #26 | Exceptional $64,253 |
| Immigrants | Switzerland | 100.0 /100 | #27 | Exceptional $63,944 |
| Russians | 100.0 /100 | #28 | Exceptional $63,939 |