Immigrants from Korea vs Yakama Householder Income Under 25 years
COMPARE
Immigrants from Korea
Yakama
Householder Income Under 25 years
Householder Income Under 25 years Comparison
Immigrants from Korea
Yakama
$55,716
HOUSEHOLDER INCOME UNDER 25 YEARS
100.0/ 100
METRIC RATING
42nd/ 347
METRIC RANK
$54,321
HOUSEHOLDER INCOME UNDER 25 YEARS
99.5/ 100
METRIC RATING
88th/ 347
METRIC RANK
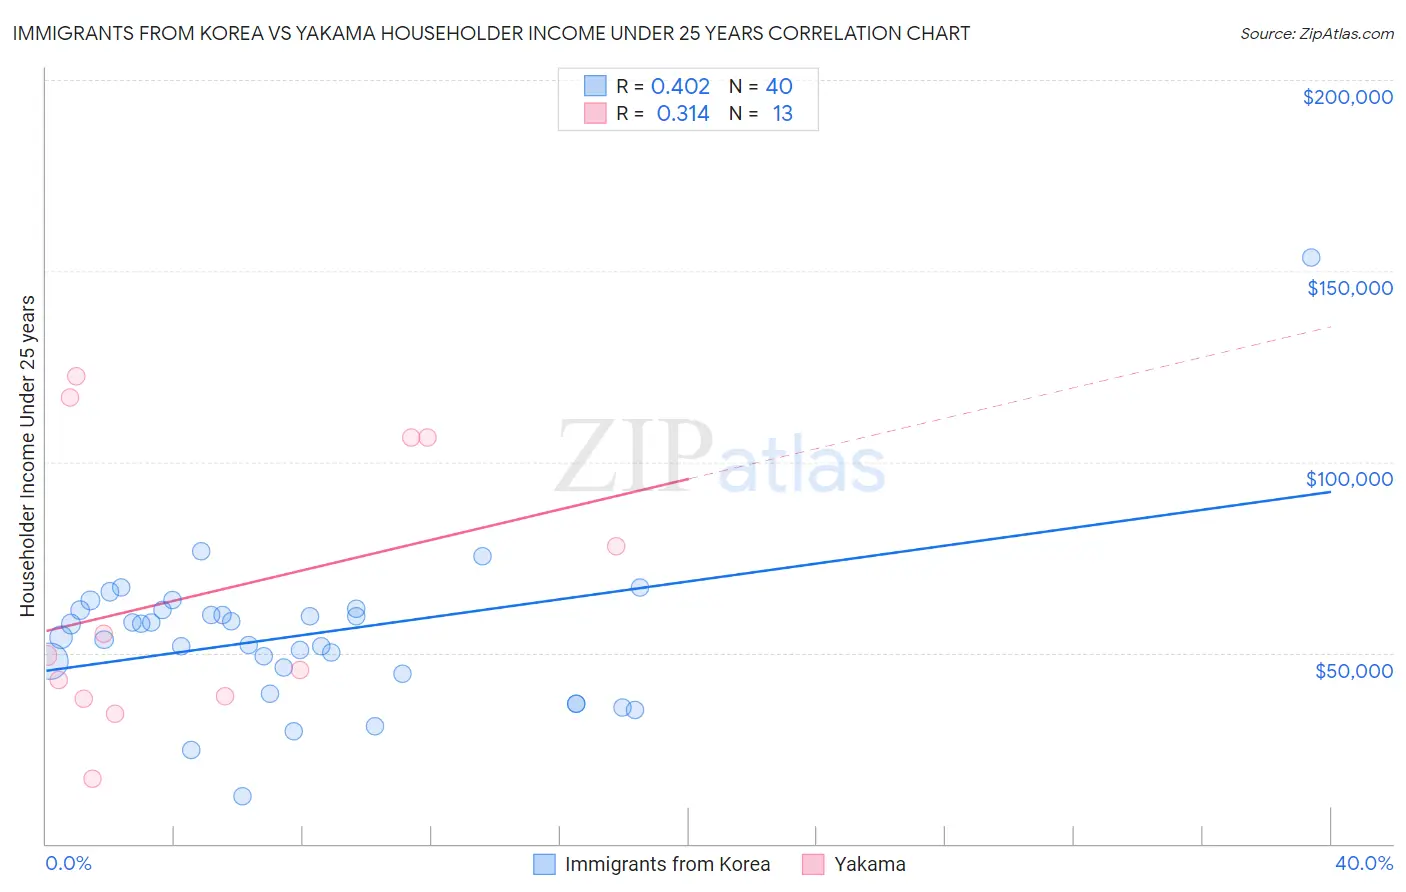
Immigrants from Korea vs Yakama Householder Income Under 25 years Correlation Chart
The statistical analysis conducted on geographies consisting of 348,325,836 people shows a moderate positive correlation between the proportion of Immigrants from Korea and household income with householder under the age of 25 in the United States with a correlation coefficient (R) of 0.402 and weighted average of $55,716. Similarly, the statistical analysis conducted on geographies consisting of 18,988,829 people shows a mild positive correlation between the proportion of Yakama and household income with householder under the age of 25 in the United States with a correlation coefficient (R) of 0.314 and weighted average of $54,321, a difference of 2.6%.
Householder Income Under 25 years Correlation Summary
| Measurement | Immigrants from Korea | Yakama |
| Minimum | $12,383 | $17,019 |
| Maximum | $153,485 | $122,325 |
| Range | $141,102 | $105,306 |
| Mean | $54,433 | $65,370 |
| Median | $55,776 | $49,297 |
| Interquartile 25% (IQ1) | $45,346 | $38,384 |
| Interquartile 75% (IQ3) | $61,192 | $106,250 |
| Interquartile Range (IQR) | $15,846 | $67,866 |
| Standard Deviation (Sample) | $21,118 | $35,875 |
| Standard Deviation (Population) | $20,853 | $34,468 |
Similar Demographics by Householder Income Under 25 years
Demographics Similar to Immigrants from Korea by Householder Income Under 25 years
In terms of householder income under 25 years, the demographic groups most similar to Immigrants from Korea are Immigrants from South Eastern Asia ($55,714, a difference of 0.0%), Immigrants from Greece ($55,727, a difference of 0.020%), Immigrants from Guyana ($55,726, a difference of 0.020%), Immigrants from Belarus ($55,743, a difference of 0.050%), and Paraguayan ($55,614, a difference of 0.18%).
| Demographics | Rating | Rank | Householder Income Under 25 years |
| Tlingit-Haida | 100.0 /100 | #35 | Exceptional $55,914 |
| Immigrants | Israel | 100.0 /100 | #36 | Exceptional $55,913 |
| Immigrants | Russia | 100.0 /100 | #37 | Exceptional $55,891 |
| Immigrants | Iran | 100.0 /100 | #38 | Exceptional $55,880 |
| Immigrants | Belarus | 100.0 /100 | #39 | Exceptional $55,743 |
| Immigrants | Greece | 100.0 /100 | #40 | Exceptional $55,727 |
| Immigrants | Guyana | 100.0 /100 | #41 | Exceptional $55,726 |
| Immigrants | Korea | 100.0 /100 | #42 | Exceptional $55,716 |
| Immigrants | South Eastern Asia | 100.0 /100 | #43 | Exceptional $55,714 |
| Paraguayans | 100.0 /100 | #44 | Exceptional $55,614 |
| Spanish American Indians | 100.0 /100 | #45 | Exceptional $55,573 |
| Immigrants | Eastern Europe | 100.0 /100 | #46 | Exceptional $55,572 |
| Cambodians | 100.0 /100 | #47 | Exceptional $55,571 |
| Immigrants | Vietnam | 100.0 /100 | #48 | Exceptional $55,562 |
| Iranians | 100.0 /100 | #49 | Exceptional $55,548 |
Demographics Similar to Yakama by Householder Income Under 25 years
In terms of householder income under 25 years, the demographic groups most similar to Yakama are Brazilian ($54,335, a difference of 0.030%), Immigrants from Croatia ($54,343, a difference of 0.040%), Bulgarian ($54,352, a difference of 0.060%), Immigrants from Czechoslovakia ($54,352, a difference of 0.060%), and Laotian ($54,369, a difference of 0.090%).
| Demographics | Rating | Rank | Householder Income Under 25 years |
| Portuguese | 99.6 /100 | #81 | Exceptional $54,436 |
| Russians | 99.5 /100 | #82 | Exceptional $54,389 |
| Laotians | 99.5 /100 | #83 | Exceptional $54,369 |
| Bulgarians | 99.5 /100 | #84 | Exceptional $54,352 |
| Immigrants | Czechoslovakia | 99.5 /100 | #85 | Exceptional $54,352 |
| Immigrants | Croatia | 99.5 /100 | #86 | Exceptional $54,343 |
| Brazilians | 99.5 /100 | #87 | Exceptional $54,335 |
| Yakama | 99.5 /100 | #88 | Exceptional $54,321 |
| Immigrants | South America | 99.4 /100 | #89 | Exceptional $54,268 |
| Turks | 99.4 /100 | #90 | Exceptional $54,266 |
| Immigrants | Egypt | 99.3 /100 | #91 | Exceptional $54,239 |
| Immigrants | St. Vincent and the Grenadines | 99.3 /100 | #92 | Exceptional $54,230 |
| Immigrants | Argentina | 99.3 /100 | #93 | Exceptional $54,209 |
| Immigrants | Sierra Leone | 99.3 /100 | #94 | Exceptional $54,190 |
| Immigrants | Malaysia | 99.2 /100 | #95 | Exceptional $54,179 |