Immigrants from Nigeria vs Immigrants from Africa Median Household Income
COMPARE
Immigrants from Nigeria
Immigrants from Africa
Median Household Income
Median Household Income Comparison
Immigrants from Nigeria
Immigrants from Africa
$81,236
MEDIAN HOUSEHOLD INCOME
7.7/ 100
METRIC RATING
222nd/ 347
METRIC RANK
$83,289
MEDIAN HOUSEHOLD INCOME
23.8/ 100
METRIC RATING
204th/ 347
METRIC RANK
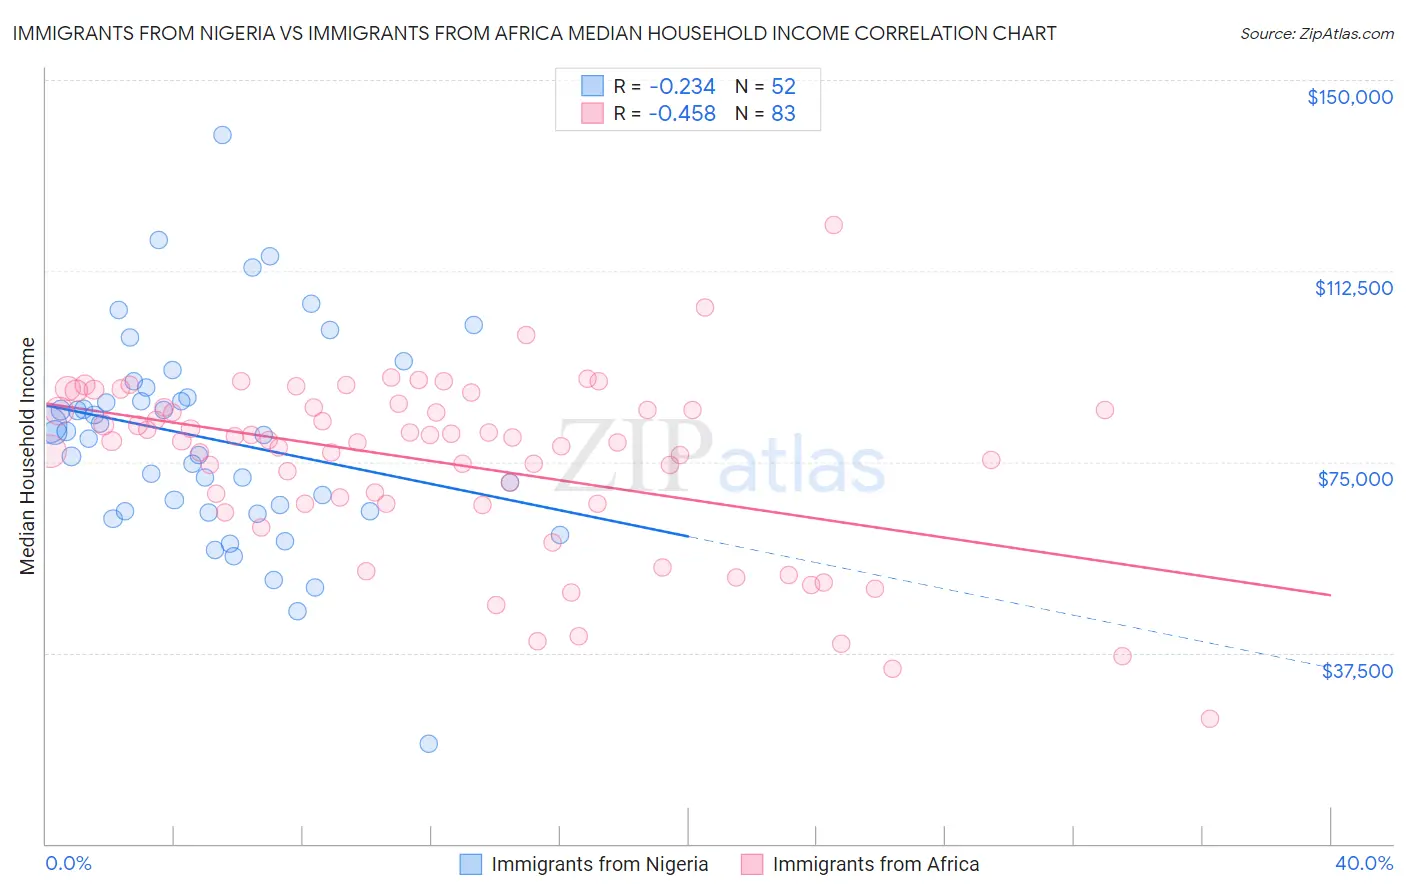
Immigrants from Nigeria vs Immigrants from Africa Median Household Income Correlation Chart
The statistical analysis conducted on geographies consisting of 283,225,999 people shows a weak negative correlation between the proportion of Immigrants from Nigeria and median household income in the United States with a correlation coefficient (R) of -0.234 and weighted average of $81,236. Similarly, the statistical analysis conducted on geographies consisting of 468,807,581 people shows a moderate negative correlation between the proportion of Immigrants from Africa and median household income in the United States with a correlation coefficient (R) of -0.458 and weighted average of $83,289, a difference of 2.5%.
Median Household Income Correlation Summary
| Measurement | Immigrants from Nigeria | Immigrants from Africa |
| Minimum | $19,722 | $24,660 |
| Maximum | $139,152 | $121,421 |
| Range | $119,430 | $96,761 |
| Mean | $79,398 | $74,867 |
| Median | $80,475 | $79,143 |
| Interquartile 25% (IQ1) | $65,224 | $66,824 |
| Interquartile 75% (IQ3) | $88,599 | $85,728 |
| Interquartile Range (IQR) | $23,375 | $18,904 |
| Standard Deviation (Sample) | $20,570 | $17,152 |
| Standard Deviation (Population) | $20,371 | $17,048 |
Demographics Similar to Immigrants from Nigeria and Immigrants from Africa by Median Household Income
In terms of median household income, the demographic groups most similar to Immigrants from Nigeria are Immigrants from El Salvador ($81,213, a difference of 0.030%), Immigrants from Ghana ($81,489, a difference of 0.31%), Immigrants from Venezuela ($81,506, a difference of 0.33%), Nigerian ($81,725, a difference of 0.60%), and White/Caucasian ($82,029, a difference of 0.98%). Similarly, the demographic groups most similar to Immigrants from Africa are Immigrants from Cambodia ($83,304, a difference of 0.020%), Celtic ($83,193, a difference of 0.11%), Immigrants from Kenya ($83,068, a difference of 0.27%), Dutch ($82,971, a difference of 0.38%), and French Canadian ($82,810, a difference of 0.58%).
| Demographics | Rating | Rank | Median Household Income |
| Immigrants | Cambodia | 24.0 /100 | #203 | Fair $83,304 |
| Immigrants | Africa | 23.8 /100 | #204 | Fair $83,289 |
| Celtics | 22.7 /100 | #205 | Fair $83,193 |
| Immigrants | Kenya | 21.3 /100 | #206 | Fair $83,068 |
| Dutch | 20.3 /100 | #207 | Fair $82,971 |
| French Canadians | 18.7 /100 | #208 | Poor $82,810 |
| Immigrants | Iraq | 16.7 /100 | #209 | Poor $82,594 |
| Immigrants | Uruguay | 16.4 /100 | #210 | Poor $82,560 |
| Salvadorans | 15.4 /100 | #211 | Poor $82,449 |
| Venezuelans | 15.3 /100 | #212 | Poor $82,432 |
| Nepalese | 15.1 /100 | #213 | Poor $82,410 |
| Panamanians | 14.0 /100 | #214 | Poor $82,272 |
| Vietnamese | 13.8 /100 | #215 | Poor $82,248 |
| Yugoslavians | 13.3 /100 | #216 | Poor $82,186 |
| Ecuadorians | 12.5 /100 | #217 | Poor $82,070 |
| Whites/Caucasians | 12.2 /100 | #218 | Poor $82,029 |
| Nigerians | 10.3 /100 | #219 | Poor $81,725 |
| Immigrants | Venezuela | 9.0 /100 | #220 | Tragic $81,506 |
| Immigrants | Ghana | 9.0 /100 | #221 | Tragic $81,489 |
| Immigrants | Nigeria | 7.7 /100 | #222 | Tragic $81,236 |
| Immigrants | El Salvador | 7.6 /100 | #223 | Tragic $81,213 |