Immigrants from Panama vs Immigrants from Greece Householder Income Under 25 years
COMPARE
Immigrants from Panama
Immigrants from Greece
Householder Income Under 25 years
Householder Income Under 25 years Comparison
Immigrants from Panama
Immigrants from Greece
$51,278
HOUSEHOLDER INCOME UNDER 25 YEARS
9.7/ 100
METRIC RATING
212th/ 347
METRIC RANK
$55,727
HOUSEHOLDER INCOME UNDER 25 YEARS
100.0/ 100
METRIC RATING
40th/ 347
METRIC RANK
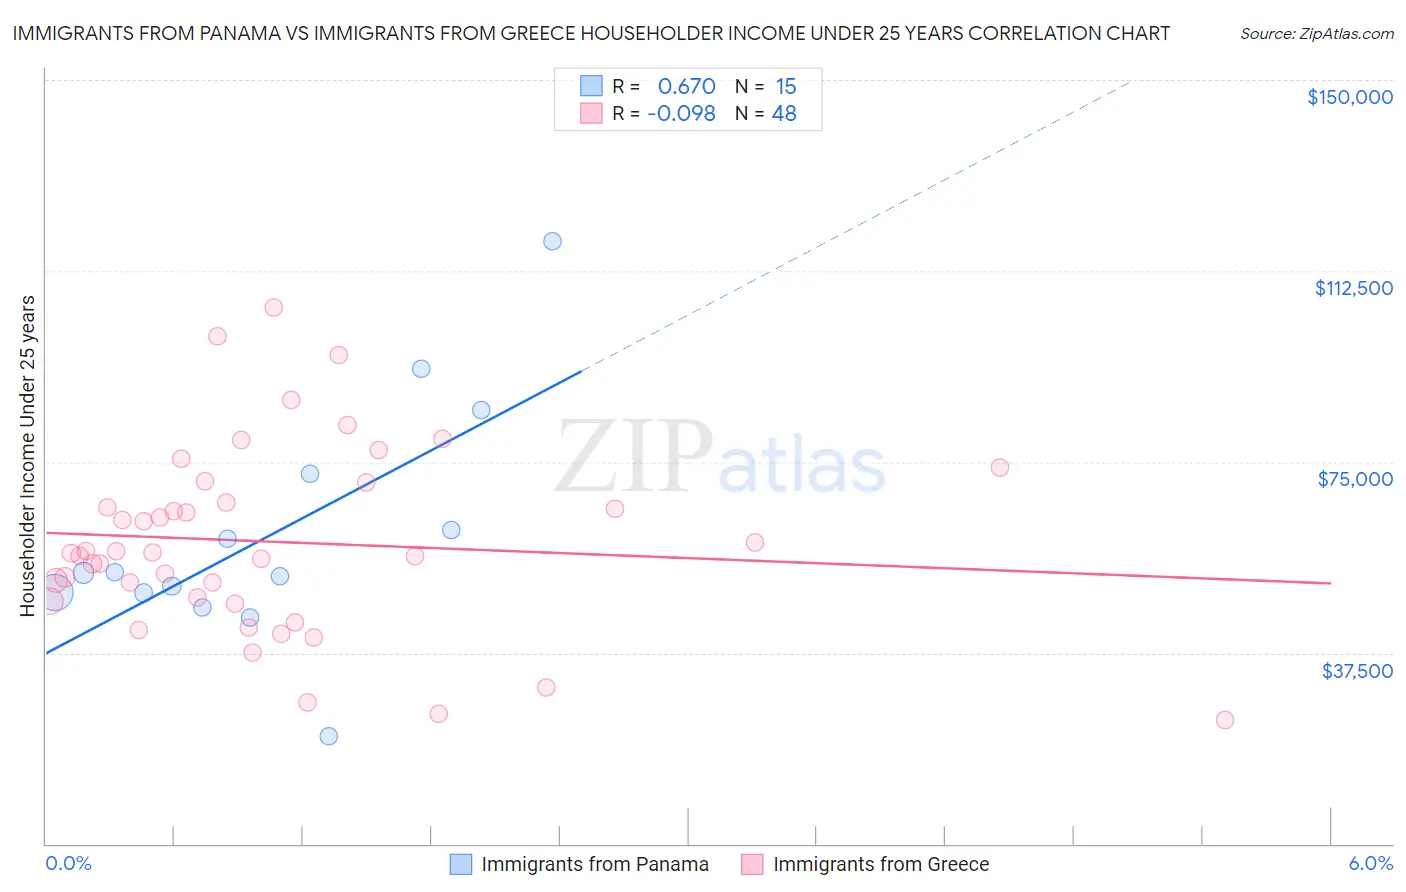
Immigrants from Panama vs Immigrants from Greece Householder Income Under 25 years Correlation Chart
The statistical analysis conducted on geographies consisting of 198,007,977 people shows a significant positive correlation between the proportion of Immigrants from Panama and household income with householder under the age of 25 in the United States with a correlation coefficient (R) of 0.670 and weighted average of $51,278. Similarly, the statistical analysis conducted on geographies consisting of 185,686,081 people shows a slight negative correlation between the proportion of Immigrants from Greece and household income with householder under the age of 25 in the United States with a correlation coefficient (R) of -0.098 and weighted average of $55,727, a difference of 8.7%.
Householder Income Under 25 years Correlation Summary
| Measurement | Immigrants from Panama | Immigrants from Greece |
| Minimum | $21,042 | $24,293 |
| Maximum | $118,375 | $105,434 |
| Range | $97,333 | $81,141 |
| Mean | $60,736 | $59,276 |
| Median | $53,162 | $57,171 |
| Interquartile 25% (IQ1) | $49,230 | $47,996 |
| Interquartile 75% (IQ3) | $72,697 | $68,938 |
| Interquartile Range (IQR) | $23,467 | $20,942 |
| Standard Deviation (Sample) | $23,474 | $18,152 |
| Standard Deviation (Population) | $22,678 | $17,962 |
Similar Demographics by Householder Income Under 25 years
Demographics Similar to Immigrants from Panama by Householder Income Under 25 years
In terms of householder income under 25 years, the demographic groups most similar to Immigrants from Panama are Dutch ($51,265, a difference of 0.030%), Zimbabwean ($51,259, a difference of 0.040%), Icelander ($51,247, a difference of 0.060%), Irish ($51,317, a difference of 0.080%), and French ($51,230, a difference of 0.090%).
| Demographics | Rating | Rank | Householder Income Under 25 years |
| Cape Verdeans | 12.3 /100 | #205 | Poor $51,387 |
| Immigrants | Latin America | 12.3 /100 | #206 | Poor $51,387 |
| South Africans | 12.2 /100 | #207 | Poor $51,383 |
| Immigrants | Jordan | 11.9 /100 | #208 | Poor $51,370 |
| Syrians | 11.4 /100 | #209 | Poor $51,353 |
| Immigrants | Ghana | 10.9 /100 | #210 | Poor $51,333 |
| Irish | 10.6 /100 | #211 | Poor $51,317 |
| Immigrants | Panama | 9.7 /100 | #212 | Tragic $51,278 |
| Dutch | 9.4 /100 | #213 | Tragic $51,265 |
| Zimbabweans | 9.3 /100 | #214 | Tragic $51,259 |
| Icelanders | 9.1 /100 | #215 | Tragic $51,247 |
| French | 8.7 /100 | #216 | Tragic $51,230 |
| Czechoslovakians | 8.6 /100 | #217 | Tragic $51,224 |
| Immigrants | Belize | 8.6 /100 | #218 | Tragic $51,223 |
| Arabs | 8.5 /100 | #219 | Tragic $51,219 |
Demographics Similar to Immigrants from Greece by Householder Income Under 25 years
In terms of householder income under 25 years, the demographic groups most similar to Immigrants from Greece are Immigrants from Guyana ($55,726, a difference of 0.0%), Immigrants from Korea ($55,716, a difference of 0.020%), Immigrants from South Eastern Asia ($55,714, a difference of 0.020%), Immigrants from Belarus ($55,743, a difference of 0.030%), and Paraguayan ($55,614, a difference of 0.20%).
| Demographics | Rating | Rank | Householder Income Under 25 years |
| Inupiat | 100.0 /100 | #33 | Exceptional $55,935 |
| Immigrants | Japan | 100.0 /100 | #34 | Exceptional $55,932 |
| Tlingit-Haida | 100.0 /100 | #35 | Exceptional $55,914 |
| Immigrants | Israel | 100.0 /100 | #36 | Exceptional $55,913 |
| Immigrants | Russia | 100.0 /100 | #37 | Exceptional $55,891 |
| Immigrants | Iran | 100.0 /100 | #38 | Exceptional $55,880 |
| Immigrants | Belarus | 100.0 /100 | #39 | Exceptional $55,743 |
| Immigrants | Greece | 100.0 /100 | #40 | Exceptional $55,727 |
| Immigrants | Guyana | 100.0 /100 | #41 | Exceptional $55,726 |
| Immigrants | Korea | 100.0 /100 | #42 | Exceptional $55,716 |
| Immigrants | South Eastern Asia | 100.0 /100 | #43 | Exceptional $55,714 |
| Paraguayans | 100.0 /100 | #44 | Exceptional $55,614 |
| Spanish American Indians | 100.0 /100 | #45 | Exceptional $55,573 |
| Immigrants | Eastern Europe | 100.0 /100 | #46 | Exceptional $55,572 |
| Cambodians | 100.0 /100 | #47 | Exceptional $55,571 |