Immigrants from Peru vs Osage Householder Income Ages 45 - 64 years
COMPARE
Immigrants from Peru
Osage
Householder Income Ages 45 - 64 years
Householder Income Ages 45 - 64 years Comparison
Immigrants from Peru
Osage
$103,173
HOUSEHOLDER INCOME AGES 45 - 64 YEARS
80.7/ 100
METRIC RATING
150th/ 347
METRIC RANK
$88,390
HOUSEHOLDER INCOME AGES 45 - 64 YEARS
0.3/ 100
METRIC RATING
264th/ 347
METRIC RANK
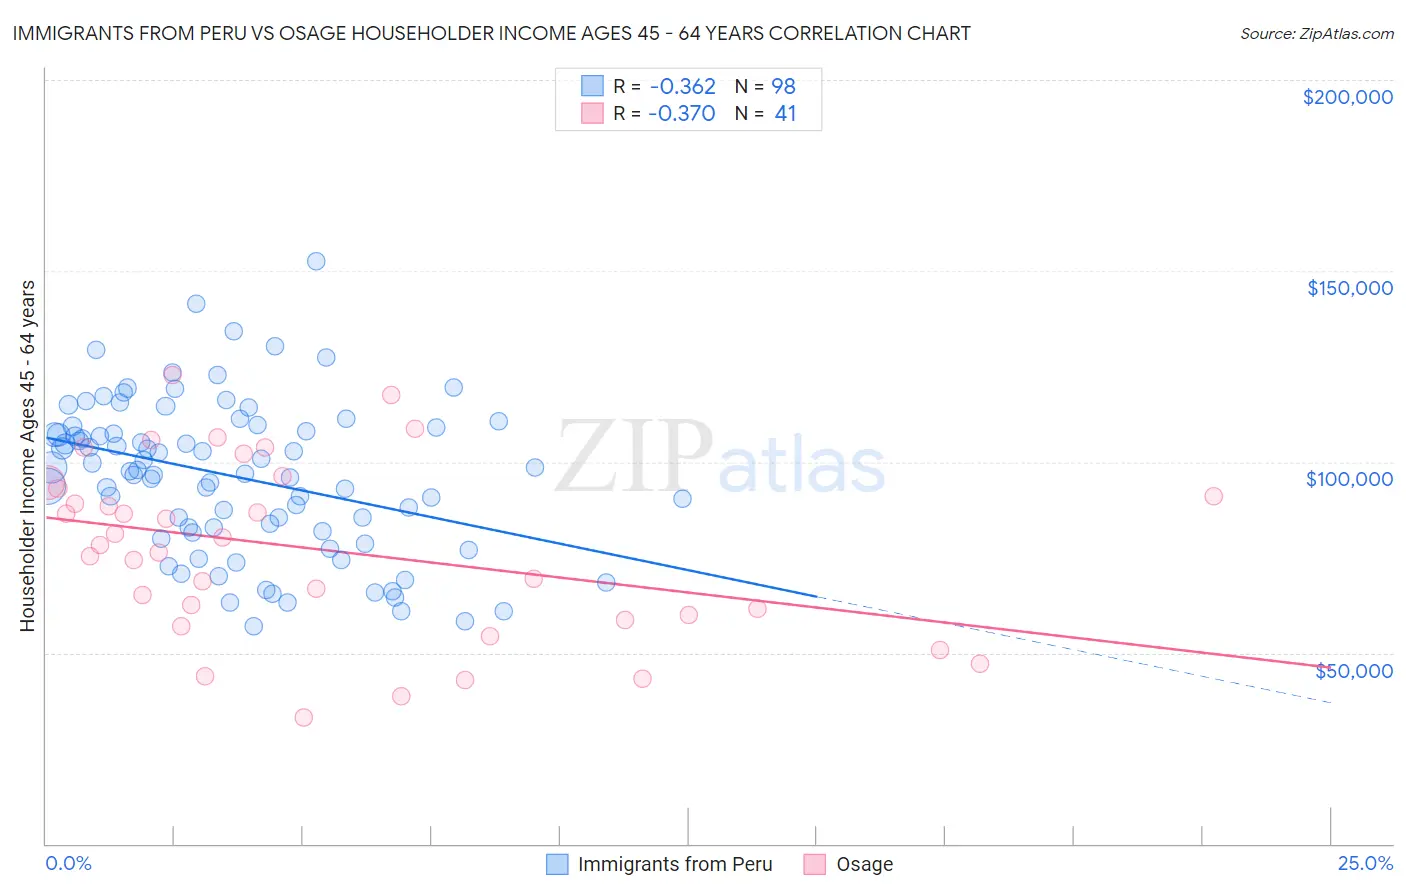
Immigrants from Peru vs Osage Householder Income Ages 45 - 64 years Correlation Chart
The statistical analysis conducted on geographies consisting of 328,568,384 people shows a mild negative correlation between the proportion of Immigrants from Peru and household income with householder between the ages 45 and 64 in the United States with a correlation coefficient (R) of -0.362 and weighted average of $103,173. Similarly, the statistical analysis conducted on geographies consisting of 91,774,888 people shows a mild negative correlation between the proportion of Osage and household income with householder between the ages 45 and 64 in the United States with a correlation coefficient (R) of -0.370 and weighted average of $88,390, a difference of 16.7%.
Householder Income Ages 45 - 64 years Correlation Summary
| Measurement | Immigrants from Peru | Osage |
| Minimum | $56,875 | $33,125 |
| Maximum | $152,612 | $122,824 |
| Range | $95,737 | $89,699 |
| Mean | $96,084 | $76,991 |
| Median | $97,801 | $78,120 |
| Interquartile 25% (IQ1) | $81,677 | $59,314 |
| Interquartile 75% (IQ3) | $109,063 | $93,781 |
| Interquartile Range (IQR) | $27,386 | $34,467 |
| Standard Deviation (Sample) | $20,026 | $22,918 |
| Standard Deviation (Population) | $19,924 | $22,637 |
Similar Demographics by Householder Income Ages 45 - 64 years
Demographics Similar to Immigrants from Peru by Householder Income Ages 45 - 64 years
In terms of householder income ages 45 - 64 years, the demographic groups most similar to Immigrants from Peru are Immigrants from Sierra Leone ($103,227, a difference of 0.050%), Swiss ($103,071, a difference of 0.10%), Irish ($103,067, a difference of 0.10%), Immigrants from Germany ($103,282, a difference of 0.11%), and Scandinavian ($102,969, a difference of 0.20%).
| Demographics | Rating | Rank | Householder Income Ages 45 - 64 years |
| Serbians | 83.2 /100 | #143 | Excellent $103,522 |
| Czechs | 83.1 /100 | #144 | Excellent $103,507 |
| Ugandans | 82.9 /100 | #145 | Excellent $103,472 |
| Immigrants | Chile | 82.5 /100 | #146 | Excellent $103,412 |
| Basques | 82.3 /100 | #147 | Excellent $103,387 |
| Immigrants | Germany | 81.5 /100 | #148 | Excellent $103,282 |
| Immigrants | Sierra Leone | 81.1 /100 | #149 | Excellent $103,227 |
| Immigrants | Peru | 80.7 /100 | #150 | Excellent $103,173 |
| Swiss | 79.9 /100 | #151 | Good $103,071 |
| Irish | 79.8 /100 | #152 | Good $103,067 |
| Scandinavians | 79.0 /100 | #153 | Good $102,969 |
| Slovenes | 78.3 /100 | #154 | Good $102,885 |
| Costa Ricans | 77.4 /100 | #155 | Good $102,779 |
| Carpatho Rusyns | 77.4 /100 | #156 | Good $102,777 |
| Immigrants | Ethiopia | 77.3 /100 | #157 | Good $102,763 |
Demographics Similar to Osage by Householder Income Ages 45 - 64 years
In terms of householder income ages 45 - 64 years, the demographic groups most similar to Osage are Immigrants from Senegal ($88,421, a difference of 0.040%), Jamaican ($88,327, a difference of 0.070%), Somali ($88,600, a difference of 0.24%), Immigrants from West Indies ($88,164, a difference of 0.26%), and Hmong ($88,115, a difference of 0.31%).
| Demographics | Rating | Rank | Householder Income Ages 45 - 64 years |
| German Russians | 0.4 /100 | #257 | Tragic $89,398 |
| Immigrants | Barbados | 0.4 /100 | #258 | Tragic $89,394 |
| Immigrants | Nicaragua | 0.4 /100 | #259 | Tragic $89,108 |
| Liberians | 0.3 /100 | #260 | Tragic $88,929 |
| Belizeans | 0.3 /100 | #261 | Tragic $88,684 |
| Somalis | 0.3 /100 | #262 | Tragic $88,600 |
| Immigrants | Senegal | 0.3 /100 | #263 | Tragic $88,421 |
| Osage | 0.3 /100 | #264 | Tragic $88,390 |
| Jamaicans | 0.2 /100 | #265 | Tragic $88,327 |
| Immigrants | West Indies | 0.2 /100 | #266 | Tragic $88,164 |
| Hmong | 0.2 /100 | #267 | Tragic $88,115 |
| Immigrants | Micronesia | 0.2 /100 | #268 | Tragic $87,864 |
| Spanish Americans | 0.2 /100 | #269 | Tragic $87,836 |
| Immigrants | Liberia | 0.2 /100 | #270 | Tragic $87,739 |
| Guatemalans | 0.2 /100 | #271 | Tragic $87,705 |