Immigrants from Senegal vs Barbadian Householder Income Over 65 years
COMPARE
Immigrants from Senegal
Barbadian
Householder Income Over 65 years
Householder Income Over 65 years Comparison
Immigrants from Senegal
Barbadians
$54,447
HOUSEHOLDER INCOME OVER 65 YEARS
0.1/ 100
METRIC RATING
270th/ 347
METRIC RANK
$54,163
HOUSEHOLDER INCOME OVER 65 YEARS
0.1/ 100
METRIC RATING
274th/ 347
METRIC RANK
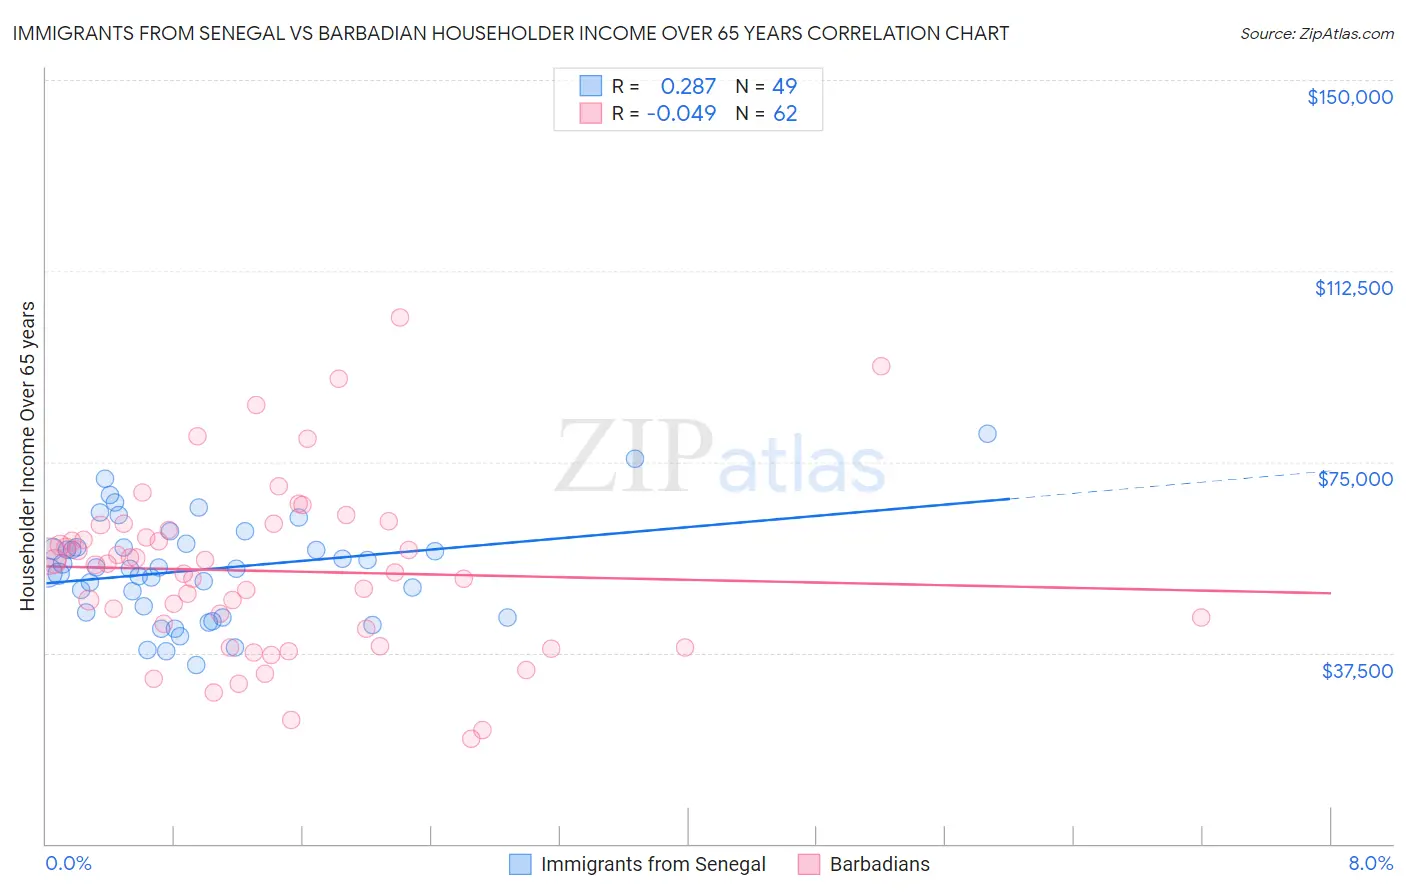
Immigrants from Senegal vs Barbadian Householder Income Over 65 years Correlation Chart
The statistical analysis conducted on geographies consisting of 90,018,715 people shows a weak positive correlation between the proportion of Immigrants from Senegal and household income with householder over the age of 65 in the United States with a correlation coefficient (R) of 0.287 and weighted average of $54,447. Similarly, the statistical analysis conducted on geographies consisting of 141,115,722 people shows no correlation between the proportion of Barbadians and household income with householder over the age of 65 in the United States with a correlation coefficient (R) of -0.049 and weighted average of $54,163, a difference of 0.52%.
Householder Income Over 65 years Correlation Summary
| Measurement | Immigrants from Senegal | Barbadian |
| Minimum | $35,208 | $20,697 |
| Maximum | $80,537 | $103,317 |
| Range | $45,329 | $82,620 |
| Mean | $53,928 | $53,555 |
| Median | $54,081 | $54,900 |
| Interquartile 25% (IQ1) | $44,902 | $42,188 |
| Interquartile 75% (IQ3) | $58,588 | $61,698 |
| Interquartile Range (IQR) | $13,686 | $19,510 |
| Standard Deviation (Sample) | $10,096 | $16,744 |
| Standard Deviation (Population) | $9,992 | $16,609 |
Demographics Similar to Immigrants from Senegal and Barbadians by Householder Income Over 65 years
In terms of householder income over 65 years, the demographic groups most similar to Immigrants from Senegal are Nicaraguan ($54,474, a difference of 0.050%), Immigrants from Zaire ($54,512, a difference of 0.12%), Guatemalan ($54,526, a difference of 0.15%), Liberian ($54,356, a difference of 0.17%), and Jamaican ($54,560, a difference of 0.21%). Similarly, the demographic groups most similar to Barbadians are Indonesian ($54,176, a difference of 0.020%), Cherokee ($54,133, a difference of 0.060%), Cree ($54,129, a difference of 0.060%), Potawatomi ($54,212, a difference of 0.090%), and Cheyenne ($54,096, a difference of 0.12%).
| Demographics | Rating | Rank | Householder Income Over 65 years |
| Bangladeshis | 0.1 /100 | #262 | Tragic $54,719 |
| French American Indians | 0.1 /100 | #263 | Tragic $54,699 |
| Apache | 0.1 /100 | #264 | Tragic $54,668 |
| Belizeans | 0.1 /100 | #265 | Tragic $54,580 |
| Jamaicans | 0.1 /100 | #266 | Tragic $54,560 |
| Guatemalans | 0.1 /100 | #267 | Tragic $54,526 |
| Immigrants | Zaire | 0.1 /100 | #268 | Tragic $54,512 |
| Nicaraguans | 0.1 /100 | #269 | Tragic $54,474 |
| Immigrants | Senegal | 0.1 /100 | #270 | Tragic $54,447 |
| Liberians | 0.1 /100 | #271 | Tragic $54,356 |
| Potawatomi | 0.1 /100 | #272 | Tragic $54,212 |
| Indonesians | 0.1 /100 | #273 | Tragic $54,176 |
| Barbadians | 0.1 /100 | #274 | Tragic $54,163 |
| Cherokee | 0.1 /100 | #275 | Tragic $54,133 |
| Cree | 0.1 /100 | #276 | Tragic $54,129 |
| Cheyenne | 0.1 /100 | #277 | Tragic $54,096 |
| Immigrants | Ecuador | 0.1 /100 | #278 | Tragic $54,030 |
| Blackfeet | 0.1 /100 | #279 | Tragic $54,029 |
| Immigrants | Jamaica | 0.1 /100 | #280 | Tragic $54,027 |
| Somalis | 0.1 /100 | #281 | Tragic $54,004 |
| Immigrants | Armenia | 0.1 /100 | #282 | Tragic $53,974 |