Immigrants from Switzerland vs Immigrants from Ukraine Householder Income Under 25 years
COMPARE
Immigrants from Switzerland
Immigrants from Ukraine
Householder Income Under 25 years
Householder Income Under 25 years Comparison
Immigrants from Switzerland
Immigrants from Ukraine
$53,528
HOUSEHOLDER INCOME UNDER 25 YEARS
96.3/ 100
METRIC RATING
118th/ 347
METRIC RANK
$55,447
HOUSEHOLDER INCOME UNDER 25 YEARS
100.0/ 100
METRIC RATING
55th/ 347
METRIC RANK
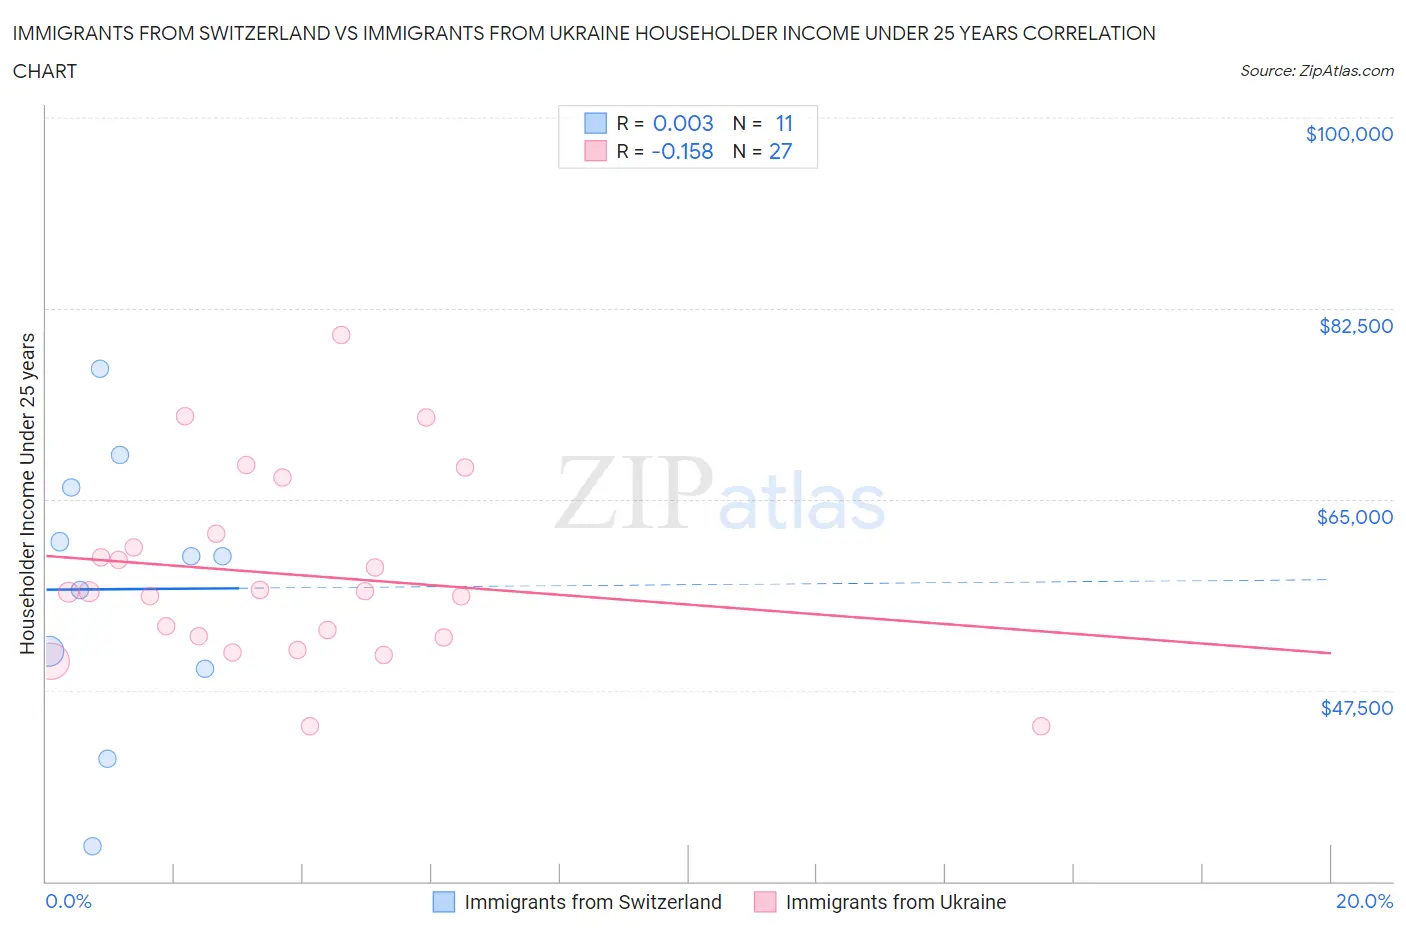
Immigrants from Switzerland vs Immigrants from Ukraine Householder Income Under 25 years Correlation Chart
The statistical analysis conducted on geographies consisting of 131,601,890 people shows no correlation between the proportion of Immigrants from Switzerland and household income with householder under the age of 25 in the United States with a correlation coefficient (R) of 0.003 and weighted average of $53,528. Similarly, the statistical analysis conducted on geographies consisting of 247,734,480 people shows a poor negative correlation between the proportion of Immigrants from Ukraine and household income with householder under the age of 25 in the United States with a correlation coefficient (R) of -0.158 and weighted average of $55,447, a difference of 3.6%.
Householder Income Under 25 years Correlation Summary
| Measurement | Immigrants from Switzerland | Immigrants from Ukraine |
| Minimum | $33,221 | $44,212 |
| Maximum | $77,010 | $80,041 |
| Range | $43,789 | $35,830 |
| Mean | $56,771 | $58,153 |
| Median | $59,792 | $56,546 |
| Interquartile 25% (IQ1) | $49,500 | $52,321 |
| Interquartile 75% (IQ3) | $66,059 | $61,864 |
| Interquartile Range (IQR) | $16,559 | $9,543 |
| Standard Deviation (Sample) | $12,523 | $8,615 |
| Standard Deviation (Population) | $11,940 | $8,454 |
Similar Demographics by Householder Income Under 25 years
Demographics Similar to Immigrants from Switzerland by Householder Income Under 25 years
In terms of householder income under 25 years, the demographic groups most similar to Immigrants from Switzerland are Lithuanian ($53,552, a difference of 0.050%), Immigrants from Spain ($53,560, a difference of 0.060%), Immigrants from Albania ($53,597, a difference of 0.13%), Immigrants from Sweden ($53,621, a difference of 0.17%), and Italian ($53,426, a difference of 0.19%).
| Demographics | Rating | Rank | Householder Income Under 25 years |
| Immigrants | Colombia | 97.7 /100 | #111 | Exceptional $53,714 |
| Immigrants | Oceania | 97.5 /100 | #112 | Exceptional $53,680 |
| Romanians | 97.2 /100 | #113 | Exceptional $53,632 |
| Immigrants | Sweden | 97.1 /100 | #114 | Exceptional $53,621 |
| Immigrants | Albania | 96.9 /100 | #115 | Exceptional $53,597 |
| Immigrants | Spain | 96.6 /100 | #116 | Exceptional $53,560 |
| Lithuanians | 96.6 /100 | #117 | Exceptional $53,552 |
| Immigrants | Switzerland | 96.3 /100 | #118 | Exceptional $53,528 |
| Italians | 95.4 /100 | #119 | Exceptional $53,426 |
| Guamanians/Chamorros | 95.3 /100 | #120 | Exceptional $53,423 |
| Immigrants | Canada | 95.2 /100 | #121 | Exceptional $53,411 |
| Immigrants | Ethiopia | 95.2 /100 | #122 | Exceptional $53,408 |
| Immigrants | Iraq | 94.9 /100 | #123 | Exceptional $53,384 |
| Colombians | 94.6 /100 | #124 | Exceptional $53,357 |
| Pakistanis | 94.1 /100 | #125 | Exceptional $53,325 |
Demographics Similar to Immigrants from Ukraine by Householder Income Under 25 years
In terms of householder income under 25 years, the demographic groups most similar to Immigrants from Ukraine are Sri Lankan ($55,470, a difference of 0.040%), Immigrants from Poland ($55,474, a difference of 0.050%), Salvadoran ($55,412, a difference of 0.060%), Immigrants from Romania ($55,522, a difference of 0.13%), and Immigrants from Indonesia ($55,521, a difference of 0.13%).
| Demographics | Rating | Rank | Householder Income Under 25 years |
| Immigrants | Vietnam | 100.0 /100 | #48 | Exceptional $55,562 |
| Iranians | 100.0 /100 | #49 | Exceptional $55,548 |
| Puget Sound Salish | 100.0 /100 | #50 | Exceptional $55,543 |
| Immigrants | Romania | 100.0 /100 | #51 | Exceptional $55,522 |
| Immigrants | Indonesia | 100.0 /100 | #52 | Exceptional $55,521 |
| Immigrants | Poland | 100.0 /100 | #53 | Exceptional $55,474 |
| Sri Lankans | 100.0 /100 | #54 | Exceptional $55,470 |
| Immigrants | Ukraine | 100.0 /100 | #55 | Exceptional $55,447 |
| Salvadorans | 100.0 /100 | #56 | Exceptional $55,412 |
| Soviet Union | 100.0 /100 | #57 | Exceptional $55,340 |
| Guyanese | 99.9 /100 | #58 | Exceptional $55,210 |
| Native Hawaiians | 99.9 /100 | #59 | Exceptional $55,158 |
| Immigrants | Lithuania | 99.9 /100 | #60 | Exceptional $55,028 |
| Immigrants | Europe | 99.9 /100 | #61 | Exceptional $55,022 |
| Immigrants | Uzbekistan | 99.8 /100 | #62 | Exceptional $54,846 |