Immigrants from Uruguay vs Immigrants from Bulgaria Wage/Income Gap
COMPARE
Immigrants from Uruguay
Immigrants from Bulgaria
Wage/Income Gap
Wage/Income Gap Comparison
Immigrants from Uruguay
Immigrants from Bulgaria
24.6%
WAGE/INCOME GAP
93.8/ 100
METRIC RATING
126th/ 347
METRIC RANK
26.3%
WAGE/INCOME GAP
22.5/ 100
METRIC RATING
192nd/ 347
METRIC RANK
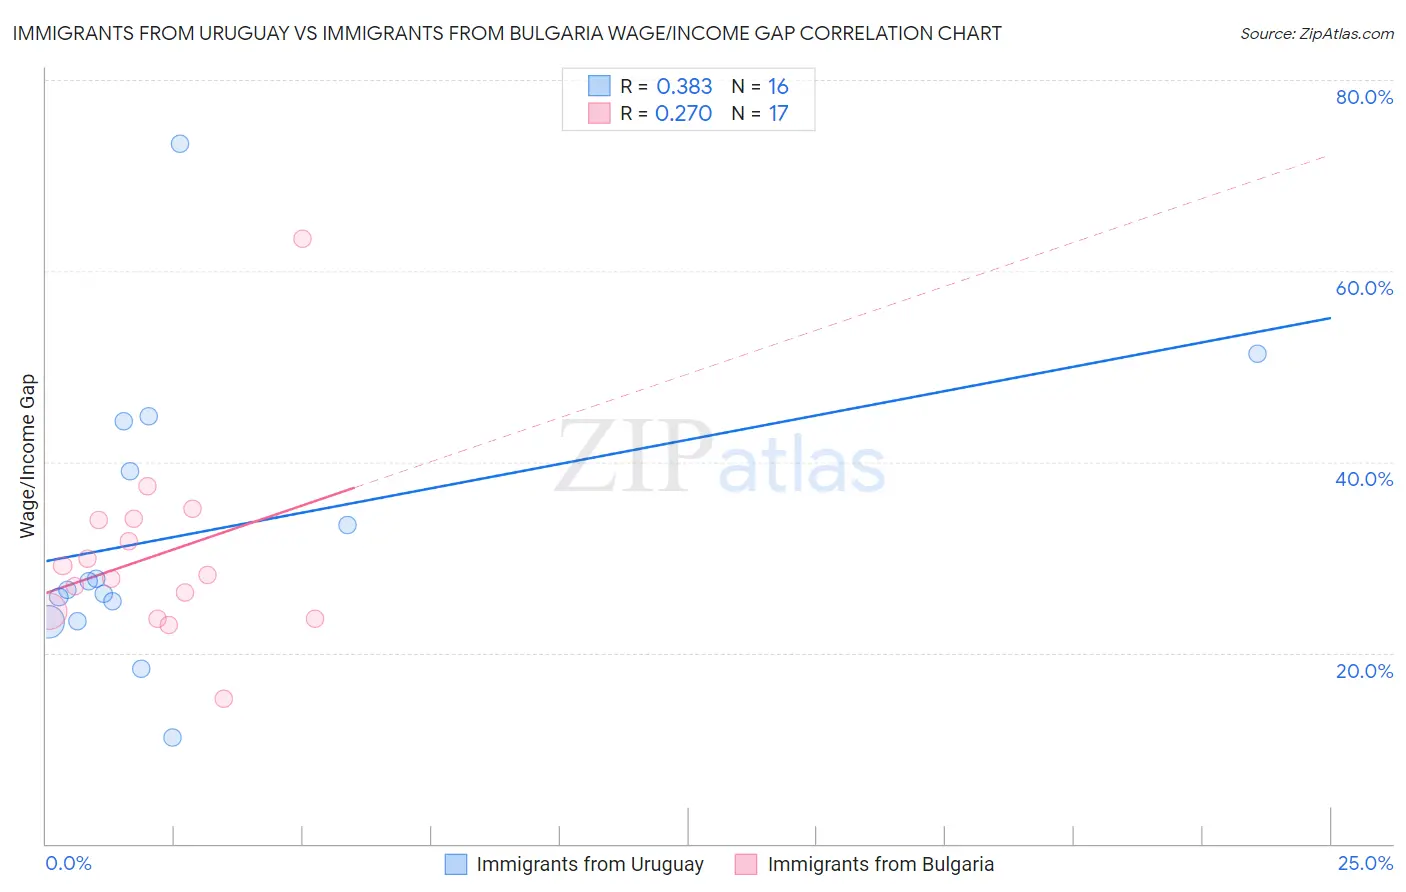
Immigrants from Uruguay vs Immigrants from Bulgaria Wage/Income Gap Correlation Chart
The statistical analysis conducted on geographies consisting of 133,243,894 people shows a mild positive correlation between the proportion of Immigrants from Uruguay and wage/income gap percentage in the United States with a correlation coefficient (R) of 0.383 and weighted average of 24.6%. Similarly, the statistical analysis conducted on geographies consisting of 172,517,670 people shows a weak positive correlation between the proportion of Immigrants from Bulgaria and wage/income gap percentage in the United States with a correlation coefficient (R) of 0.270 and weighted average of 26.3%, a difference of 6.7%.
Wage/Income Gap Correlation Summary
| Measurement | Immigrants from Uruguay | Immigrants from Bulgaria |
| Minimum | 11.1% | 15.1% |
| Maximum | 73.3% | 63.4% |
| Range | 62.2% | 48.3% |
| Mean | 32.6% | 30.2% |
| Median | 27.1% | 28.2% |
| Interquartile 25% (IQ1) | 24.3% | 24.0% |
| Interquartile 75% (IQ3) | 41.7% | 34.0% |
| Interquartile Range (IQR) | 17.3% | 10.0% |
| Standard Deviation (Sample) | 15.1% | 10.2% |
| Standard Deviation (Population) | 14.6% | 9.8% |
Similar Demographics by Wage/Income Gap
Demographics Similar to Immigrants from Uruguay by Wage/Income Gap
In terms of wage/income gap, the demographic groups most similar to Immigrants from Uruguay are German Russian (24.6%, a difference of 0.010%), Spanish American (24.6%, a difference of 0.020%), Immigrants from South America (24.6%, a difference of 0.040%), Immigrants from Central America (24.6%, a difference of 0.070%), and Yup'ik (24.7%, a difference of 0.13%).
| Demographics | Rating | Rank | Wage/Income Gap |
| Kenyans | 95.8 /100 | #119 | Exceptional 24.5% |
| Cree | 95.6 /100 | #120 | Exceptional 24.5% |
| Immigrants | Thailand | 94.9 /100 | #121 | Exceptional 24.5% |
| Apache | 94.8 /100 | #122 | Exceptional 24.5% |
| Natives/Alaskans | 94.6 /100 | #123 | Exceptional 24.6% |
| Immigrants | South America | 93.9 /100 | #124 | Exceptional 24.6% |
| Spanish Americans | 93.8 /100 | #125 | Exceptional 24.6% |
| Immigrants | Uruguay | 93.8 /100 | #126 | Exceptional 24.6% |
| German Russians | 93.7 /100 | #127 | Exceptional 24.6% |
| Immigrants | Central America | 93.5 /100 | #128 | Exceptional 24.6% |
| Yup'ik | 93.3 /100 | #129 | Exceptional 24.7% |
| Alsatians | 93.2 /100 | #130 | Exceptional 24.7% |
| Immigrants | Philippines | 93.0 /100 | #131 | Exceptional 24.7% |
| Immigrants | Costa Rica | 92.4 /100 | #132 | Exceptional 24.7% |
| Colombians | 92.4 /100 | #133 | Exceptional 24.7% |
Demographics Similar to Immigrants from Bulgaria by Wage/Income Gap
In terms of wage/income gap, the demographic groups most similar to Immigrants from Bulgaria are Immigrants from Jordan (26.3%, a difference of 0.020%), Chilean (26.3%, a difference of 0.020%), Immigrants from Malaysia (26.3%, a difference of 0.030%), Immigrants from Western Asia (26.3%, a difference of 0.080%), and Zimbabwean (26.3%, a difference of 0.090%).
| Demographics | Rating | Rank | Wage/Income Gap |
| Pakistanis | 33.7 /100 | #185 | Fair 26.1% |
| Immigrants | Indonesia | 32.5 /100 | #186 | Fair 26.1% |
| Palestinians | 29.9 /100 | #187 | Fair 26.1% |
| Immigrants | Egypt | 29.9 /100 | #188 | Fair 26.1% |
| Immigrants | Moldova | 26.6 /100 | #189 | Fair 26.2% |
| Immigrants | Croatia | 24.8 /100 | #190 | Fair 26.2% |
| Immigrants | Venezuela | 24.7 /100 | #191 | Fair 26.2% |
| Immigrants | Bulgaria | 22.5 /100 | #192 | Fair 26.3% |
| Immigrants | Jordan | 22.4 /100 | #193 | Fair 26.3% |
| Chileans | 22.3 /100 | #194 | Fair 26.3% |
| Immigrants | Malaysia | 22.2 /100 | #195 | Fair 26.3% |
| Immigrants | Western Asia | 21.7 /100 | #196 | Fair 26.3% |
| Zimbabweans | 21.6 /100 | #197 | Fair 26.3% |
| Venezuelans | 21.5 /100 | #198 | Fair 26.3% |
| Dutch West Indians | 21.0 /100 | #199 | Fair 26.3% |