Immigrants from West Indies vs Korean Median Earnings
COMPARE
Immigrants from West Indies
Korean
Median Earnings
Median Earnings Comparison
Immigrants from West Indies
Koreans
$43,989
MEDIAN EARNINGS
3.1/ 100
METRIC RATING
246th/ 347
METRIC RANK
$48,727
MEDIAN EARNINGS
96.2/ 100
METRIC RATING
116th/ 347
METRIC RANK
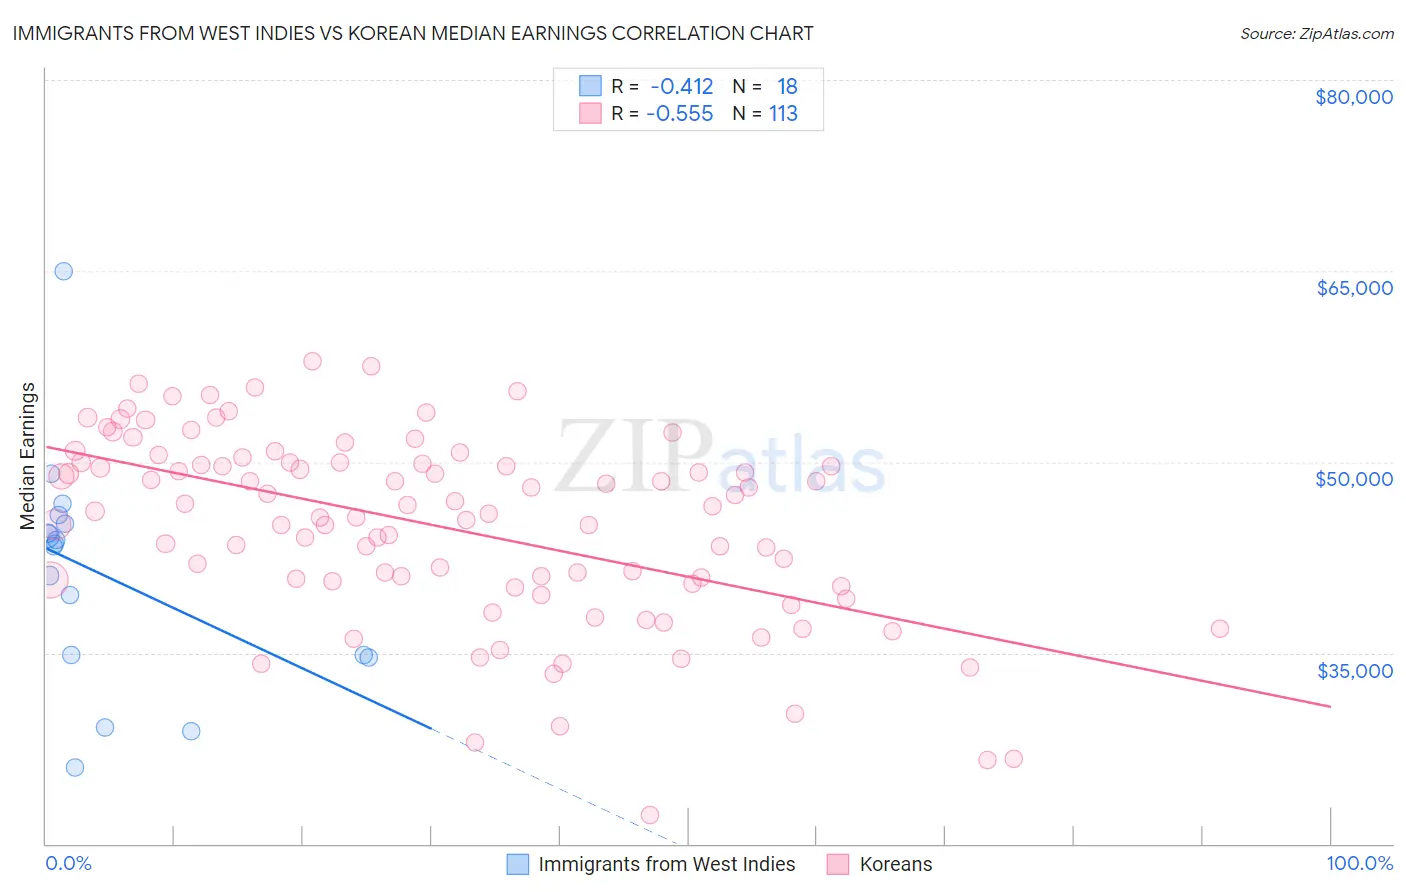
Immigrants from West Indies vs Korean Median Earnings Correlation Chart
The statistical analysis conducted on geographies consisting of 72,420,477 people shows a moderate negative correlation between the proportion of Immigrants from West Indies and median earnings in the United States with a correlation coefficient (R) of -0.412 and weighted average of $43,989. Similarly, the statistical analysis conducted on geographies consisting of 510,900,863 people shows a substantial negative correlation between the proportion of Koreans and median earnings in the United States with a correlation coefficient (R) of -0.555 and weighted average of $48,727, a difference of 10.8%.
Median Earnings Correlation Summary
| Measurement | Immigrants from West Indies | Korean |
| Minimum | $26,000 | $22,216 |
| Maximum | $64,982 | $57,875 |
| Range | $38,982 | $35,659 |
| Mean | $41,111 | $44,924 |
| Median | $43,487 | $46,110 |
| Interquartile 25% (IQ1) | $34,810 | $40,528 |
| Interquartile 75% (IQ3) | $45,119 | $49,935 |
| Interquartile Range (IQR) | $10,309 | $9,407 |
| Standard Deviation (Sample) | $9,035 | $7,353 |
| Standard Deviation (Population) | $8,780 | $7,320 |
Similar Demographics by Median Earnings
Demographics Similar to Immigrants from West Indies by Median Earnings
In terms of median earnings, the demographic groups most similar to Immigrants from West Indies are Immigrants from Burma/Myanmar ($43,998, a difference of 0.020%), Immigrants from Cabo Verde ($43,963, a difference of 0.060%), Subsaharan African ($44,118, a difference of 0.29%), Nonimmigrants ($44,117, a difference of 0.29%), and Nepalese ($43,860, a difference of 0.29%).
| Demographics | Rating | Rank | Median Earnings |
| Senegalese | 5.3 /100 | #239 | Tragic $44,373 |
| Aleuts | 4.4 /100 | #240 | Tragic $44,241 |
| Samoans | 4.2 /100 | #241 | Tragic $44,206 |
| Immigrants | Venezuela | 4.0 /100 | #242 | Tragic $44,163 |
| Sub-Saharan Africans | 3.7 /100 | #243 | Tragic $44,118 |
| Immigrants | Nonimmigrants | 3.7 /100 | #244 | Tragic $44,117 |
| Immigrants | Burma/Myanmar | 3.2 /100 | #245 | Tragic $43,998 |
| Immigrants | West Indies | 3.1 /100 | #246 | Tragic $43,989 |
| Immigrants | Cabo Verde | 3.0 /100 | #247 | Tragic $43,963 |
| Nepalese | 2.6 /100 | #248 | Tragic $43,860 |
| Malaysians | 2.6 /100 | #249 | Tragic $43,844 |
| Alaska Natives | 2.3 /100 | #250 | Tragic $43,750 |
| Tsimshian | 2.1 /100 | #251 | Tragic $43,695 |
| Hawaiians | 2.0 /100 | #252 | Tragic $43,673 |
| Somalis | 1.8 /100 | #253 | Tragic $43,567 |
Demographics Similar to Koreans by Median Earnings
In terms of median earnings, the demographic groups most similar to Koreans are Serbian ($48,677, a difference of 0.10%), Immigrants from Jordan ($48,673, a difference of 0.11%), Polish ($48,659, a difference of 0.14%), Chinese ($48,836, a difference of 0.22%), and Moroccan ($48,838, a difference of 0.23%).
| Demographics | Rating | Rank | Median Earnings |
| Syrians | 97.1 /100 | #109 | Exceptional $48,934 |
| Immigrants | Ethiopia | 97.1 /100 | #110 | Exceptional $48,924 |
| Immigrants | Zimbabwe | 97.0 /100 | #111 | Exceptional $48,913 |
| Northern Europeans | 96.9 /100 | #112 | Exceptional $48,887 |
| Immigrants | Kuwait | 96.8 /100 | #113 | Exceptional $48,861 |
| Moroccans | 96.7 /100 | #114 | Exceptional $48,838 |
| Chinese | 96.7 /100 | #115 | Exceptional $48,836 |
| Koreans | 96.2 /100 | #116 | Exceptional $48,727 |
| Serbians | 95.9 /100 | #117 | Exceptional $48,677 |
| Immigrants | Jordan | 95.9 /100 | #118 | Exceptional $48,673 |
| Poles | 95.8 /100 | #119 | Exceptional $48,659 |
| Carpatho Rusyns | 95.5 /100 | #120 | Exceptional $48,617 |
| Arabs | 95.4 /100 | #121 | Exceptional $48,599 |
| Chileans | 94.8 /100 | #122 | Exceptional $48,504 |
| Immigrants | Syria | 93.9 /100 | #123 | Exceptional $48,375 |