Immigrants from Zimbabwe vs Lithuanian Median Female Earnings
COMPARE
Immigrants from Zimbabwe
Lithuanian
Median Female Earnings
Median Female Earnings Comparison
Immigrants from Zimbabwe
Lithuanians
$41,527
MEDIAN FEMALE EARNINGS
97.8/ 100
METRIC RATING
104th/ 347
METRIC RANK
$42,108
MEDIAN FEMALE EARNINGS
99.3/ 100
METRIC RATING
87th/ 347
METRIC RANK
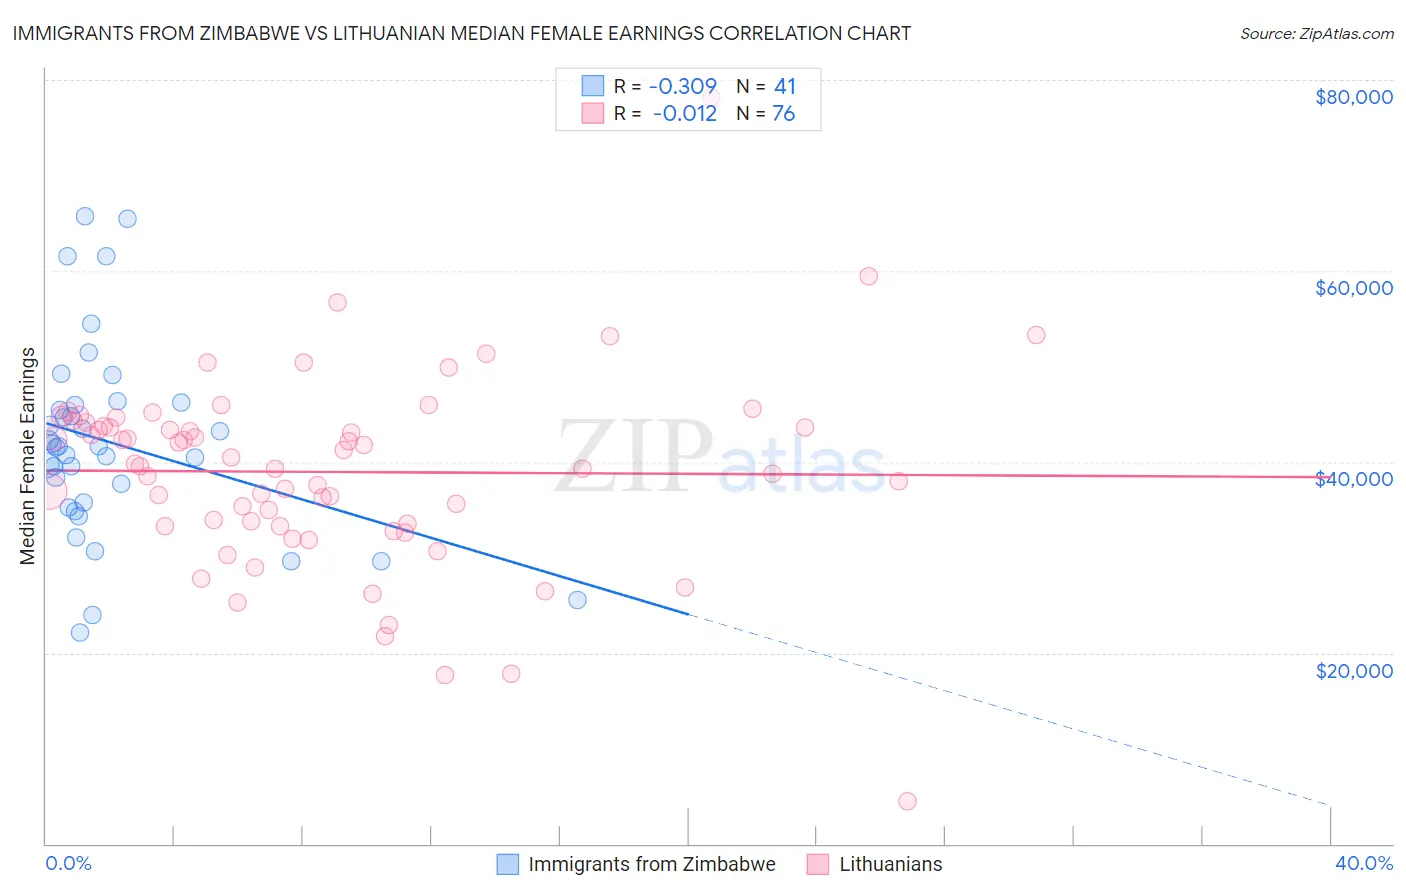
Immigrants from Zimbabwe vs Lithuanian Median Female Earnings Correlation Chart
The statistical analysis conducted on geographies consisting of 117,801,183 people shows a mild negative correlation between the proportion of Immigrants from Zimbabwe and median female earnings in the United States with a correlation coefficient (R) of -0.309 and weighted average of $41,527. Similarly, the statistical analysis conducted on geographies consisting of 421,690,318 people shows no correlation between the proportion of Lithuanians and median female earnings in the United States with a correlation coefficient (R) of -0.012 and weighted average of $42,108, a difference of 1.4%.
Median Female Earnings Correlation Summary
| Measurement | Immigrants from Zimbabwe | Lithuanian |
| Minimum | $22,161 | $4,435 |
| Maximum | $65,750 | $78,167 |
| Range | $43,589 | $73,732 |
| Mean | $42,000 | $38,946 |
| Median | $41,577 | $39,620 |
| Interquartile 25% (IQ1) | $35,499 | $33,413 |
| Interquartile 75% (IQ3) | $46,072 | $43,909 |
| Interquartile Range (IQR) | $10,573 | $10,496 |
| Standard Deviation (Sample) | $10,097 | $10,262 |
| Standard Deviation (Population) | $9,973 | $10,194 |
Demographics Similar to Immigrants from Zimbabwe and Lithuanians by Median Female Earnings
In terms of median female earnings, the demographic groups most similar to Immigrants from Zimbabwe are Italian ($41,505, a difference of 0.050%), Immigrants from Argentina ($41,554, a difference of 0.060%), Immigrants from Poland ($41,630, a difference of 0.25%), Immigrants from Fiji ($41,656, a difference of 0.31%), and Romanian ($41,663, a difference of 0.33%). Similarly, the demographic groups most similar to Lithuanians are Immigrants from St. Vincent and the Grenadines ($42,108, a difference of 0.0%), Laotian ($42,133, a difference of 0.060%), Immigrants from Northern Africa ($42,084, a difference of 0.060%), Immigrants from Afghanistan ($42,055, a difference of 0.12%), and Ukrainian ($42,015, a difference of 0.22%).
| Demographics | Rating | Rank | Median Female Earnings |
| Laotians | 99.4 /100 | #85 | Exceptional $42,133 |
| Immigrants | St. Vincent and the Grenadines | 99.3 /100 | #86 | Exceptional $42,108 |
| Lithuanians | 99.3 /100 | #87 | Exceptional $42,108 |
| Immigrants | Northern Africa | 99.3 /100 | #88 | Exceptional $42,084 |
| Immigrants | Afghanistan | 99.3 /100 | #89 | Exceptional $42,055 |
| Ukrainians | 99.2 /100 | #90 | Exceptional $42,015 |
| Immigrants | Western Europe | 99.2 /100 | #91 | Exceptional $41,990 |
| Argentineans | 99.1 /100 | #92 | Exceptional $41,952 |
| Immigrants | Grenada | 99.0 /100 | #93 | Exceptional $41,932 |
| Moroccans | 98.9 /100 | #94 | Exceptional $41,872 |
| Immigrants | Netherlands | 98.9 /100 | #95 | Exceptional $41,870 |
| South Africans | 98.8 /100 | #96 | Exceptional $41,825 |
| Immigrants | Hungary | 98.8 /100 | #97 | Exceptional $41,820 |
| Immigrants | Scotland | 98.7 /100 | #98 | Exceptional $41,771 |
| Immigrants | Barbados | 98.4 /100 | #99 | Exceptional $41,685 |
| Romanians | 98.3 /100 | #100 | Exceptional $41,663 |
| Immigrants | Fiji | 98.3 /100 | #101 | Exceptional $41,656 |
| Immigrants | Poland | 98.2 /100 | #102 | Exceptional $41,630 |
| Immigrants | Argentina | 97.9 /100 | #103 | Exceptional $41,554 |
| Immigrants | Zimbabwe | 97.8 /100 | #104 | Exceptional $41,527 |
| Italians | 97.7 /100 | #105 | Exceptional $41,505 |