Immigrants vs Immigrants from Norway Median Male Earnings
COMPARE
Immigrants
Immigrants from Norway
Median Male Earnings
Median Male Earnings Comparison
Immigrants
Immigrants from Norway
$54,168
MEDIAN MALE EARNINGS
42.1/ 100
METRIC RATING
181st/ 347
METRIC RANK
$61,628
MEDIAN MALE EARNINGS
99.9/ 100
METRIC RATING
52nd/ 347
METRIC RANK
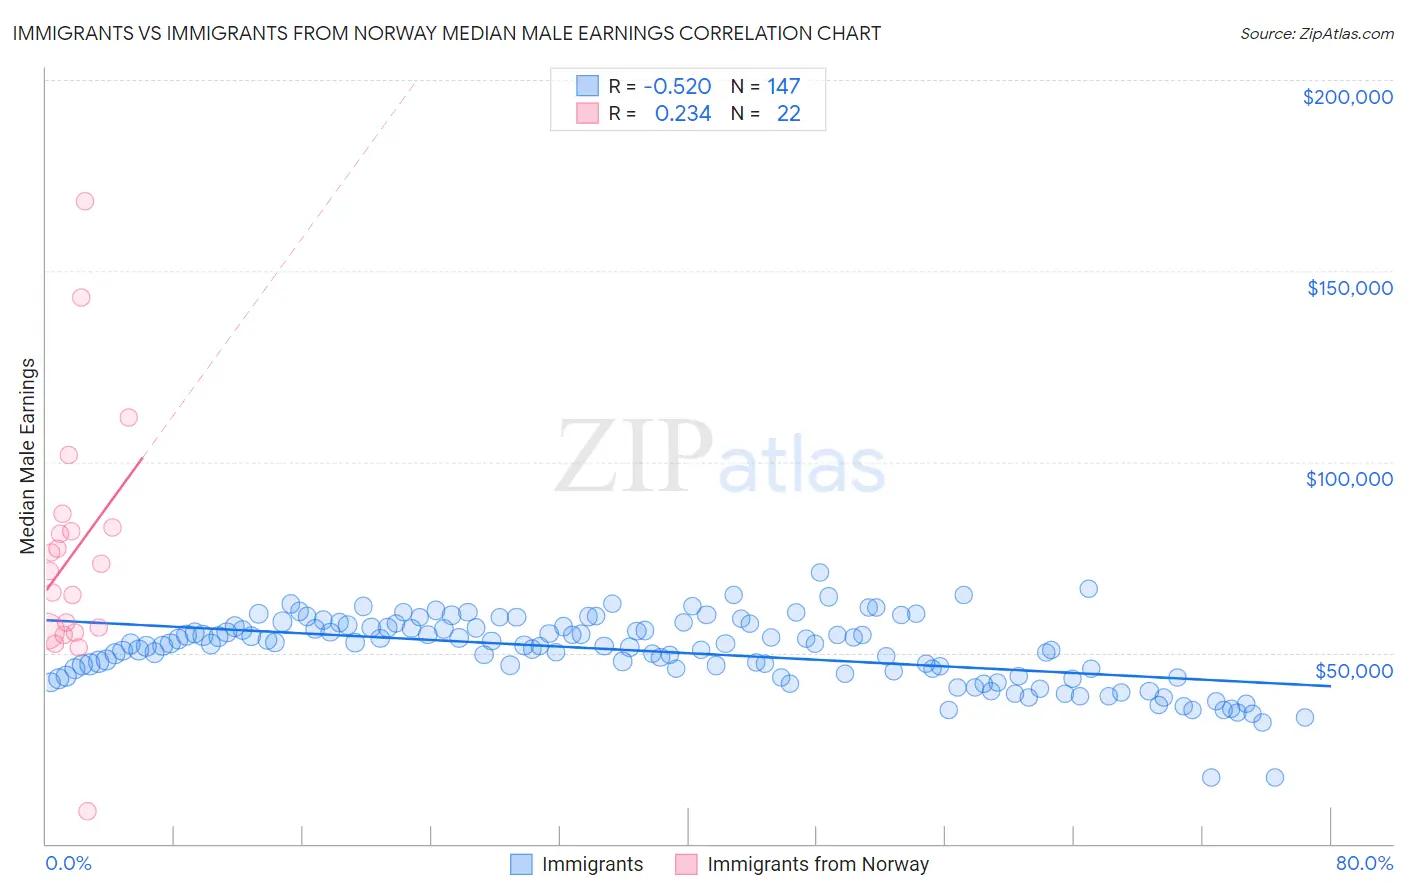
Immigrants vs Immigrants from Norway Median Male Earnings Correlation Chart
The statistical analysis conducted on geographies consisting of 575,766,345 people shows a substantial negative correlation between the proportion of Immigrants and median male earnings in the United States with a correlation coefficient (R) of -0.520 and weighted average of $54,168. Similarly, the statistical analysis conducted on geographies consisting of 116,702,945 people shows a weak positive correlation between the proportion of Immigrants from Norway and median male earnings in the United States with a correlation coefficient (R) of 0.234 and weighted average of $61,628, a difference of 13.8%.
Median Male Earnings Correlation Summary
| Measurement | Immigrants | Immigrants from Norway |
| Minimum | $17,250 | $8,547 |
| Maximum | $71,068 | $168,268 |
| Range | $53,818 | $159,721 |
| Mean | $50,484 | $76,311 |
| Median | $52,327 | $72,426 |
| Interquartile 25% (IQ1) | $44,402 | $55,593 |
| Interquartile 75% (IQ3) | $56,800 | $82,963 |
| Interquartile Range (IQR) | $12,398 | $27,370 |
| Standard Deviation (Sample) | $9,155 | $33,202 |
| Standard Deviation (Population) | $9,124 | $32,439 |
Similar Demographics by Median Male Earnings
Demographics Similar to Immigrants by Median Male Earnings
In terms of median male earnings, the demographic groups most similar to Immigrants are Iraqi ($54,182, a difference of 0.030%), Celtic ($54,242, a difference of 0.14%), Costa Rican ($54,279, a difference of 0.21%), Sierra Leonean ($54,279, a difference of 0.21%), and Yugoslavian ($53,967, a difference of 0.37%).
| Demographics | Rating | Rank | Median Male Earnings |
| South Americans | 50.0 /100 | #174 | Average $54,492 |
| Dutch | 48.0 /100 | #175 | Average $54,410 |
| Spaniards | 47.8 /100 | #176 | Average $54,401 |
| Costa Ricans | 44.8 /100 | #177 | Average $54,279 |
| Sierra Leoneans | 44.8 /100 | #178 | Average $54,279 |
| Celtics | 43.9 /100 | #179 | Average $54,242 |
| Iraqis | 42.5 /100 | #180 | Average $54,182 |
| Immigrants | Immigrants | 42.1 /100 | #181 | Average $54,168 |
| Yugoslavians | 37.4 /100 | #182 | Fair $53,967 |
| Immigrants | South America | 37.3 /100 | #183 | Fair $53,962 |
| Whites/Caucasians | 36.5 /100 | #184 | Fair $53,925 |
| Immigrants | Sierra Leone | 36.0 /100 | #185 | Fair $53,905 |
| Colombians | 34.4 /100 | #186 | Fair $53,832 |
| Immigrants | Eritrea | 31.8 /100 | #187 | Fair $53,715 |
| Immigrants | Eastern Africa | 31.8 /100 | #188 | Fair $53,713 |
Demographics Similar to Immigrants from Norway by Median Male Earnings
In terms of median male earnings, the demographic groups most similar to Immigrants from Norway are Estonian ($61,710, a difference of 0.13%), Bhutanese ($61,759, a difference of 0.21%), South African ($61,460, a difference of 0.27%), Immigrants from Latvia ($61,422, a difference of 0.34%), and Greek ($61,242, a difference of 0.63%).
| Demographics | Rating | Rank | Median Male Earnings |
| Bulgarians | 100.0 /100 | #45 | Exceptional $62,378 |
| Immigrants | Czechoslovakia | 99.9 /100 | #46 | Exceptional $62,217 |
| Immigrants | Austria | 99.9 /100 | #47 | Exceptional $62,164 |
| Immigrants | Malaysia | 99.9 /100 | #48 | Exceptional $62,121 |
| Immigrants | Europe | 99.9 /100 | #49 | Exceptional $62,057 |
| Bhutanese | 99.9 /100 | #50 | Exceptional $61,759 |
| Estonians | 99.9 /100 | #51 | Exceptional $61,710 |
| Immigrants | Norway | 99.9 /100 | #52 | Exceptional $61,628 |
| South Africans | 99.9 /100 | #53 | Exceptional $61,460 |
| Immigrants | Latvia | 99.9 /100 | #54 | Exceptional $61,422 |
| Greeks | 99.9 /100 | #55 | Exceptional $61,242 |
| Lithuanians | 99.9 /100 | #56 | Exceptional $61,228 |
| Immigrants | Scotland | 99.9 /100 | #57 | Exceptional $61,220 |
| New Zealanders | 99.9 /100 | #58 | Exceptional $61,199 |
| Immigrants | Netherlands | 99.8 /100 | #59 | Exceptional $61,096 |