Indonesian vs Immigrants from Serbia Householder Income Ages 25 - 44 years
COMPARE
Indonesian
Immigrants from Serbia
Householder Income Ages 25 - 44 years
Householder Income Ages 25 - 44 years Comparison
Indonesians
Immigrants from Serbia
$79,543
HOUSEHOLDER INCOME AGES 25 - 44 YEARS
0.0/ 100
METRIC RATING
311th/ 347
METRIC RANK
$103,155
HOUSEHOLDER INCOME AGES 25 - 44 YEARS
99.2/ 100
METRIC RATING
82nd/ 347
METRIC RANK
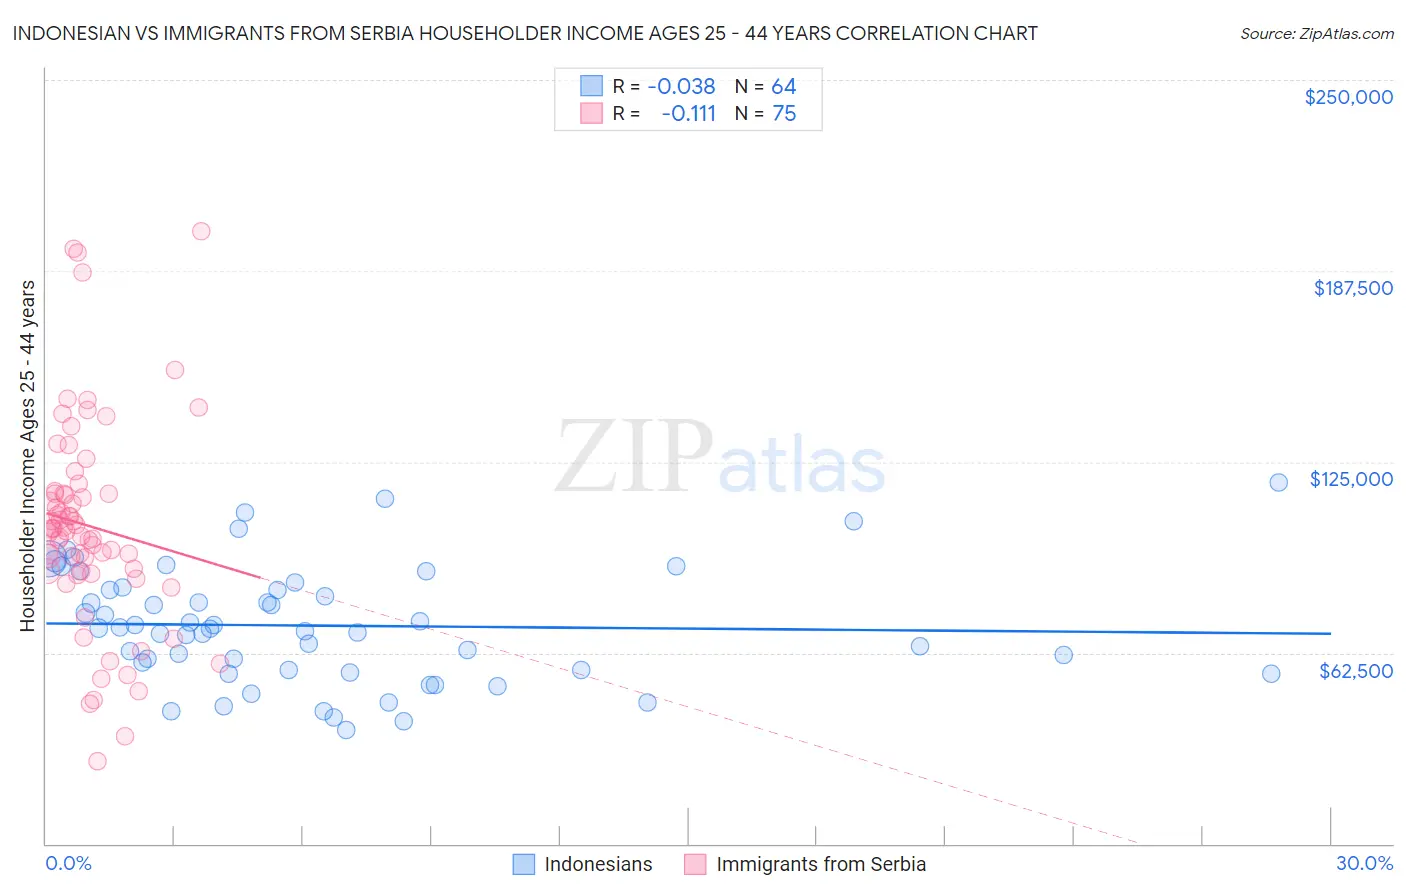
Indonesian vs Immigrants from Serbia Householder Income Ages 25 - 44 years Correlation Chart
The statistical analysis conducted on geographies consisting of 162,548,199 people shows no correlation between the proportion of Indonesians and household income with householder between the ages 25 and 44 in the United States with a correlation coefficient (R) of -0.038 and weighted average of $79,543. Similarly, the statistical analysis conducted on geographies consisting of 131,615,728 people shows a poor negative correlation between the proportion of Immigrants from Serbia and household income with householder between the ages 25 and 44 in the United States with a correlation coefficient (R) of -0.111 and weighted average of $103,155, a difference of 29.7%.
Householder Income Ages 25 - 44 years Correlation Summary
| Measurement | Indonesian | Immigrants from Serbia |
| Minimum | $37,365 | $26,950 |
| Maximum | $118,125 | $200,677 |
| Range | $80,760 | $173,727 |
| Mean | $71,416 | $104,029 |
| Median | $70,496 | $103,165 |
| Interquartile 25% (IQ1) | $56,977 | $89,260 |
| Interquartile 75% (IQ3) | $83,474 | $114,715 |
| Interquartile Range (IQR) | $26,497 | $25,456 |
| Standard Deviation (Sample) | $18,886 | $34,050 |
| Standard Deviation (Population) | $18,738 | $33,822 |
Similar Demographics by Householder Income Ages 25 - 44 years
Demographics Similar to Indonesians by Householder Income Ages 25 - 44 years
In terms of householder income ages 25 - 44 years, the demographic groups most similar to Indonesians are Immigrants from Haiti ($79,391, a difference of 0.19%), Menominee ($79,358, a difference of 0.23%), Cheyenne ($79,152, a difference of 0.49%), Fijian ($79,956, a difference of 0.52%), and Chippewa ($80,005, a difference of 0.58%).
| Demographics | Rating | Rank | Householder Income Ages 25 - 44 years |
| Immigrants | Caribbean | 0.0 /100 | #304 | Tragic $80,326 |
| Immigrants | Dominican Republic | 0.0 /100 | #305 | Tragic $80,319 |
| Apache | 0.0 /100 | #306 | Tragic $80,260 |
| Haitians | 0.0 /100 | #307 | Tragic $80,055 |
| Immigrants | Central America | 0.0 /100 | #308 | Tragic $80,012 |
| Chippewa | 0.0 /100 | #309 | Tragic $80,005 |
| Fijians | 0.0 /100 | #310 | Tragic $79,956 |
| Indonesians | 0.0 /100 | #311 | Tragic $79,543 |
| Immigrants | Haiti | 0.0 /100 | #312 | Tragic $79,391 |
| Menominee | 0.0 /100 | #313 | Tragic $79,358 |
| Cheyenne | 0.0 /100 | #314 | Tragic $79,152 |
| Ottawa | 0.0 /100 | #315 | Tragic $79,012 |
| Africans | 0.0 /100 | #316 | Tragic $78,986 |
| U.S. Virgin Islanders | 0.0 /100 | #317 | Tragic $78,911 |
| Immigrants | Mexico | 0.0 /100 | #318 | Tragic $78,809 |
Demographics Similar to Immigrants from Serbia by Householder Income Ages 25 - 44 years
In terms of householder income ages 25 - 44 years, the demographic groups most similar to Immigrants from Serbia are South African ($103,160, a difference of 0.010%), Immigrants from Egypt ($103,192, a difference of 0.040%), Argentinean ($103,111, a difference of 0.040%), Armenian ($103,248, a difference of 0.090%), and Immigrants from Philippines ($102,910, a difference of 0.24%).
| Demographics | Rating | Rank | Householder Income Ages 25 - 44 years |
| Koreans | 99.4 /100 | #75 | Exceptional $103,824 |
| Immigrants | Spain | 99.4 /100 | #76 | Exceptional $103,752 |
| Immigrants | Southern Europe | 99.3 /100 | #77 | Exceptional $103,486 |
| Immigrants | Bulgaria | 99.3 /100 | #78 | Exceptional $103,423 |
| Armenians | 99.2 /100 | #79 | Exceptional $103,248 |
| Immigrants | Egypt | 99.2 /100 | #80 | Exceptional $103,192 |
| South Africans | 99.2 /100 | #81 | Exceptional $103,160 |
| Immigrants | Serbia | 99.2 /100 | #82 | Exceptional $103,155 |
| Argentineans | 99.1 /100 | #83 | Exceptional $103,111 |
| Immigrants | Philippines | 99.0 /100 | #84 | Exceptional $102,910 |
| Immigrants | Ukraine | 98.9 /100 | #85 | Exceptional $102,664 |
| Immigrants | Hungary | 98.9 /100 | #86 | Exceptional $102,655 |
| Immigrants | Western Europe | 98.9 /100 | #87 | Exceptional $102,654 |
| Immigrants | Canada | 98.9 /100 | #88 | Exceptional $102,616 |
| Romanians | 98.8 /100 | #89 | Exceptional $102,544 |