Iranian vs Immigrants from France Median Female Earnings
COMPARE
Iranian
Immigrants from France
Median Female Earnings
Median Female Earnings Comparison
Iranians
Immigrants from France
$47,421
MEDIAN FEMALE EARNINGS
100.0/ 100
METRIC RATING
8th/ 347
METRIC RANK
$44,541
MEDIAN FEMALE EARNINGS
100.0/ 100
METRIC RATING
31st/ 347
METRIC RANK
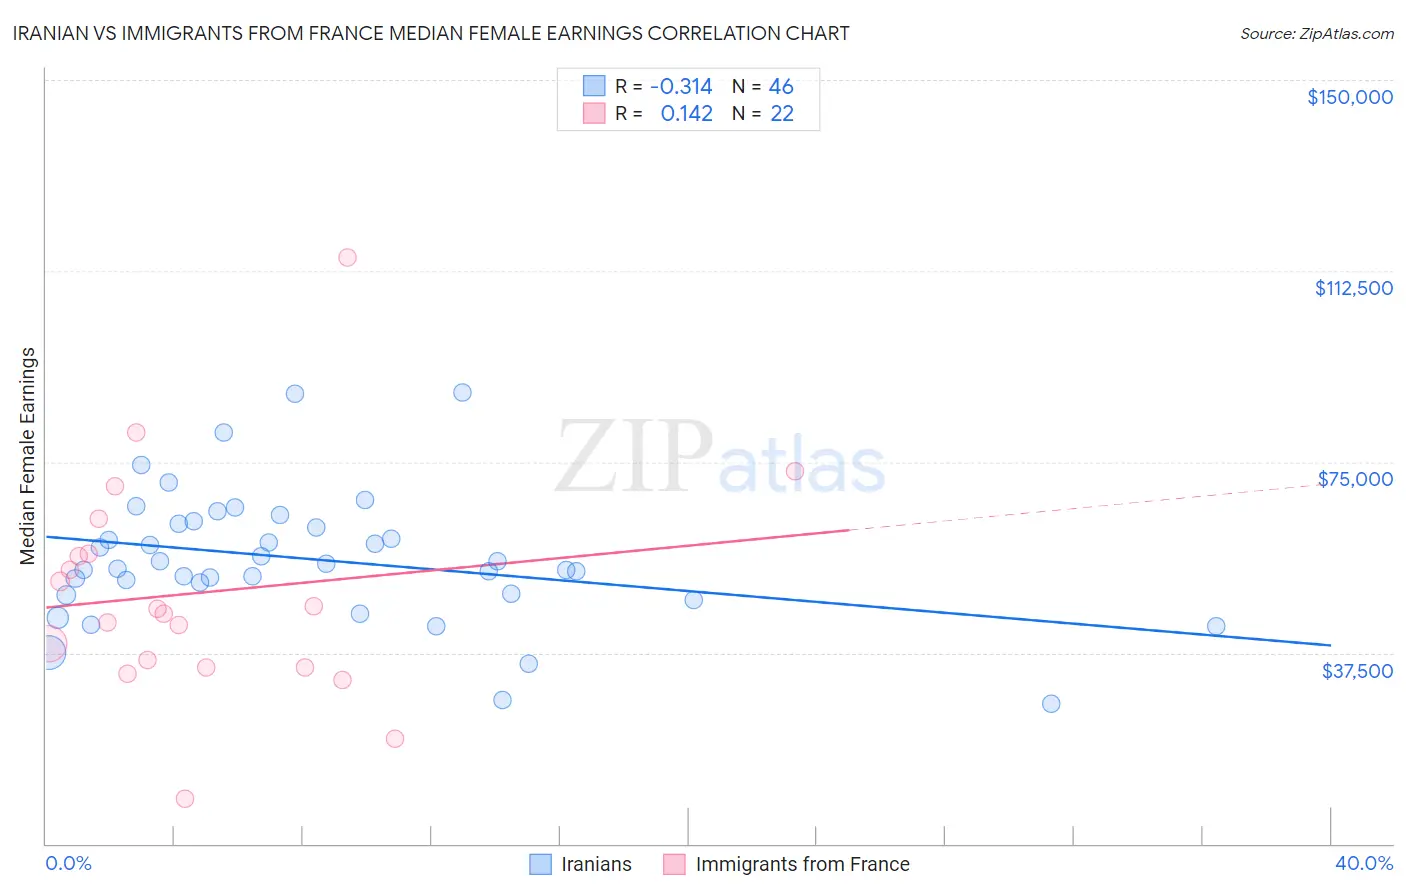
Iranian vs Immigrants from France Median Female Earnings Correlation Chart
The statistical analysis conducted on geographies consisting of 316,781,668 people shows a mild negative correlation between the proportion of Iranians and median female earnings in the United States with a correlation coefficient (R) of -0.314 and weighted average of $47,421. Similarly, the statistical analysis conducted on geographies consisting of 287,837,863 people shows a poor positive correlation between the proportion of Immigrants from France and median female earnings in the United States with a correlation coefficient (R) of 0.142 and weighted average of $44,541, a difference of 6.5%.
Median Female Earnings Correlation Summary
| Measurement | Iranian | Immigrants from France |
| Minimum | $27,465 | $8,878 |
| Maximum | $88,523 | $115,017 |
| Range | $61,058 | $106,139 |
| Mean | $55,900 | $49,372 |
| Median | $54,566 | $45,659 |
| Interquartile 25% (IQ1) | $49,107 | $34,701 |
| Interquartile 75% (IQ3) | $62,773 | $56,964 |
| Interquartile Range (IQR) | $13,666 | $22,263 |
| Standard Deviation (Sample) | $12,815 | $22,329 |
| Standard Deviation (Population) | $12,675 | $21,816 |
Similar Demographics by Median Female Earnings
Demographics Similar to Iranians by Median Female Earnings
In terms of median female earnings, the demographic groups most similar to Iranians are Thai ($47,577, a difference of 0.33%), Immigrants from Ireland ($47,598, a difference of 0.37%), Immigrants from Iran ($47,154, a difference of 0.57%), Immigrants from China ($46,972, a difference of 0.95%), and Okinawan ($46,905, a difference of 1.1%).
| Demographics | Rating | Rank | Median Female Earnings |
| Immigrants | Hong Kong | 100.0 /100 | #1 | Exceptional $49,818 |
| Filipinos | 100.0 /100 | #2 | Exceptional $49,508 |
| Immigrants | Taiwan | 100.0 /100 | #3 | Exceptional $49,256 |
| Immigrants | India | 100.0 /100 | #4 | Exceptional $48,292 |
| Immigrants | Singapore | 100.0 /100 | #5 | Exceptional $47,986 |
| Immigrants | Ireland | 100.0 /100 | #6 | Exceptional $47,598 |
| Thais | 100.0 /100 | #7 | Exceptional $47,577 |
| Iranians | 100.0 /100 | #8 | Exceptional $47,421 |
| Immigrants | Iran | 100.0 /100 | #9 | Exceptional $47,154 |
| Immigrants | China | 100.0 /100 | #10 | Exceptional $46,972 |
| Okinawans | 100.0 /100 | #11 | Exceptional $46,905 |
| Immigrants | Israel | 100.0 /100 | #12 | Exceptional $46,902 |
| Immigrants | Australia | 100.0 /100 | #13 | Exceptional $46,573 |
| Soviet Union | 100.0 /100 | #14 | Exceptional $46,556 |
| Immigrants | Eastern Asia | 100.0 /100 | #15 | Exceptional $46,502 |
Demographics Similar to Immigrants from France by Median Female Earnings
In terms of median female earnings, the demographic groups most similar to Immigrants from France are Immigrants from Belgium ($44,587, a difference of 0.10%), Asian ($44,586, a difference of 0.10%), Immigrants from Russia ($44,680, a difference of 0.31%), Turkish ($44,695, a difference of 0.34%), and Immigrants from Northern Europe ($44,366, a difference of 0.40%).
| Demographics | Rating | Rank | Median Female Earnings |
| Immigrants | Korea | 100.0 /100 | #24 | Exceptional $44,847 |
| Immigrants | Sweden | 100.0 /100 | #25 | Exceptional $44,774 |
| Immigrants | Belarus | 100.0 /100 | #26 | Exceptional $44,757 |
| Turks | 100.0 /100 | #27 | Exceptional $44,695 |
| Immigrants | Russia | 100.0 /100 | #28 | Exceptional $44,680 |
| Immigrants | Belgium | 100.0 /100 | #29 | Exceptional $44,587 |
| Asians | 100.0 /100 | #30 | Exceptional $44,586 |
| Immigrants | France | 100.0 /100 | #31 | Exceptional $44,541 |
| Immigrants | Northern Europe | 100.0 /100 | #32 | Exceptional $44,366 |
| Immigrants | Asia | 100.0 /100 | #33 | Exceptional $44,198 |
| Russians | 100.0 /100 | #34 | Exceptional $44,169 |
| Immigrants | Sri Lanka | 100.0 /100 | #35 | Exceptional $44,161 |
| Immigrants | Turkey | 100.0 /100 | #36 | Exceptional $44,066 |
| Immigrants | Switzerland | 100.0 /100 | #37 | Exceptional $43,996 |
| Latvians | 100.0 /100 | #38 | Exceptional $43,941 |