Jordanian vs Immigrants from Southern Europe Householder Income Ages 45 - 64 years
COMPARE
Jordanian
Immigrants from Southern Europe
Householder Income Ages 45 - 64 years
Householder Income Ages 45 - 64 years Comparison
Jordanians
Immigrants from Southern Europe
$109,376
HOUSEHOLDER INCOME AGES 45 - 64 YEARS
98.9/ 100
METRIC RATING
80th/ 347
METRIC RANK
$107,775
HOUSEHOLDER INCOME AGES 45 - 64 YEARS
97.7/ 100
METRIC RATING
98th/ 347
METRIC RANK
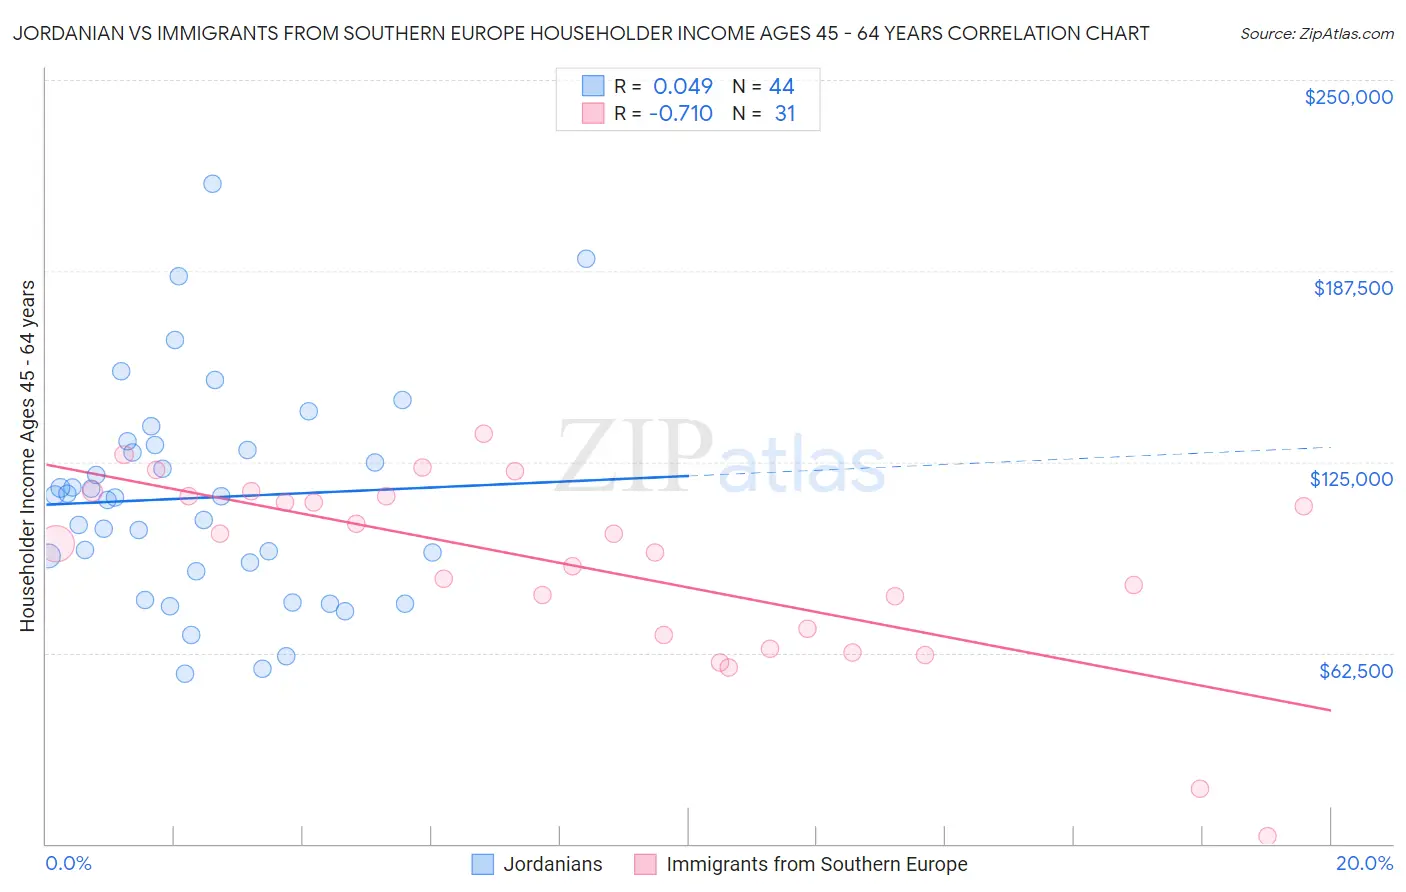
Jordanian vs Immigrants from Southern Europe Householder Income Ages 45 - 64 years Correlation Chart
The statistical analysis conducted on geographies consisting of 166,348,369 people shows no correlation between the proportion of Jordanians and household income with householder between the ages 45 and 64 in the United States with a correlation coefficient (R) of 0.049 and weighted average of $109,376. Similarly, the statistical analysis conducted on geographies consisting of 402,204,768 people shows a strong negative correlation between the proportion of Immigrants from Southern Europe and household income with householder between the ages 45 and 64 in the United States with a correlation coefficient (R) of -0.710 and weighted average of $107,775, a difference of 1.5%.
Householder Income Ages 45 - 64 years Correlation Summary
| Measurement | Jordanian | Immigrants from Southern Europe |
| Minimum | $55,625 | $2,499 |
| Maximum | $216,019 | $134,237 |
| Range | $160,394 | $131,738 |
| Mean | $113,261 | $90,713 |
| Median | $113,490 | $98,268 |
| Interquartile 25% (IQ1) | $90,534 | $68,345 |
| Interquartile 75% (IQ3) | $129,658 | $113,880 |
| Interquartile Range (IQR) | $39,124 | $45,535 |
| Standard Deviation (Sample) | $35,012 | $31,080 |
| Standard Deviation (Population) | $34,611 | $30,575 |
Demographics Similar to Jordanians and Immigrants from Southern Europe by Householder Income Ages 45 - 64 years
In terms of householder income ages 45 - 64 years, the demographic groups most similar to Jordanians are Immigrants from Bulgaria ($109,379, a difference of 0.0%), Immigrants from Eastern Europe ($109,335, a difference of 0.040%), Immigrants from North America ($109,198, a difference of 0.16%), Immigrants from Spain ($109,051, a difference of 0.30%), and Immigrants from Western Europe ($108,824, a difference of 0.51%). Similarly, the demographic groups most similar to Immigrants from Southern Europe are Palestinian ($107,721, a difference of 0.050%), Northern European ($107,870, a difference of 0.090%), Immigrants from Argentina ($108,264, a difference of 0.45%), Sri Lankan ($108,270, a difference of 0.46%), and Immigrants from Hungary ($108,267, a difference of 0.46%).
| Demographics | Rating | Rank | Householder Income Ages 45 - 64 years |
| Immigrants | Bulgaria | 98.9 /100 | #79 | Exceptional $109,379 |
| Jordanians | 98.9 /100 | #80 | Exceptional $109,376 |
| Immigrants | Eastern Europe | 98.9 /100 | #81 | Exceptional $109,335 |
| Immigrants | North America | 98.8 /100 | #82 | Exceptional $109,198 |
| Immigrants | Spain | 98.8 /100 | #83 | Exceptional $109,051 |
| Immigrants | Western Europe | 98.6 /100 | #84 | Exceptional $108,824 |
| Immigrants | Afghanistan | 98.6 /100 | #85 | Exceptional $108,785 |
| Austrians | 98.5 /100 | #86 | Exceptional $108,692 |
| Tongans | 98.5 /100 | #87 | Exceptional $108,643 |
| Romanians | 98.5 /100 | #88 | Exceptional $108,609 |
| Ukrainians | 98.3 /100 | #89 | Exceptional $108,475 |
| Immigrants | Philippines | 98.3 /100 | #90 | Exceptional $108,471 |
| Immigrants | Lebanon | 98.3 /100 | #91 | Exceptional $108,471 |
| Croatians | 98.3 /100 | #92 | Exceptional $108,383 |
| Immigrants | Croatia | 98.2 /100 | #93 | Exceptional $108,304 |
| Sri Lankans | 98.2 /100 | #94 | Exceptional $108,270 |
| Immigrants | Hungary | 98.2 /100 | #95 | Exceptional $108,267 |
| Immigrants | Argentina | 98.2 /100 | #96 | Exceptional $108,264 |
| Northern Europeans | 97.8 /100 | #97 | Exceptional $107,870 |
| Immigrants | Southern Europe | 97.7 /100 | #98 | Exceptional $107,775 |
| Palestinians | 97.6 /100 | #99 | Exceptional $107,721 |