Kiowa vs Spanish American Householder Income Under 25 years
COMPARE
Kiowa
Spanish American
Householder Income Under 25 years
Householder Income Under 25 years Comparison
Kiowa
Spanish Americans
$44,733
HOUSEHOLDER INCOME UNDER 25 YEARS
0.0/ 100
METRIC RATING
339th/ 347
METRIC RANK
$46,913
HOUSEHOLDER INCOME UNDER 25 YEARS
0.0/ 100
METRIC RATING
318th/ 347
METRIC RANK
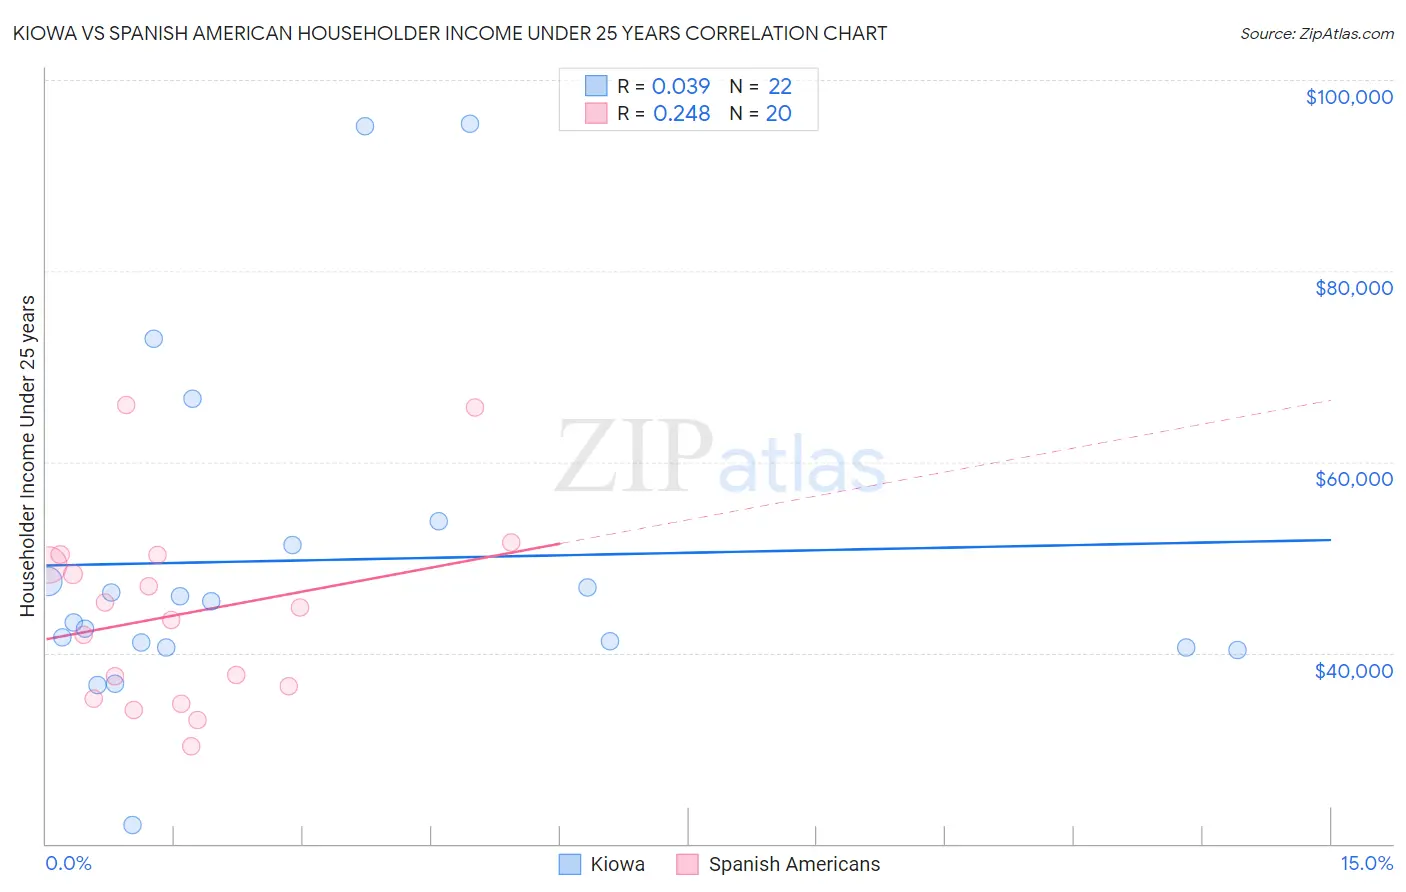
Kiowa vs Spanish American Householder Income Under 25 years Correlation Chart
The statistical analysis conducted on geographies consisting of 54,795,251 people shows no correlation between the proportion of Kiowa and household income with householder under the age of 25 in the United States with a correlation coefficient (R) of 0.039 and weighted average of $44,733. Similarly, the statistical analysis conducted on geographies consisting of 97,599,501 people shows a weak positive correlation between the proportion of Spanish Americans and household income with householder under the age of 25 in the United States with a correlation coefficient (R) of 0.248 and weighted average of $46,913, a difference of 4.9%.
Householder Income Under 25 years Correlation Summary
| Measurement | Kiowa | Spanish American |
| Minimum | $21,932 | $30,224 |
| Maximum | $95,455 | $65,953 |
| Range | $73,523 | $35,729 |
| Mean | $49,706 | $44,130 |
| Median | $44,320 | $44,094 |
| Interquartile 25% (IQ1) | $40,500 | $35,845 |
| Interquartile 75% (IQ3) | $51,250 | $49,764 |
| Interquartile Range (IQR) | $10,750 | $13,919 |
| Standard Deviation (Sample) | $17,903 | $9,911 |
| Standard Deviation (Population) | $17,492 | $9,660 |
Similar Demographics by Householder Income Under 25 years
Demographics Similar to Kiowa by Householder Income Under 25 years
In terms of householder income under 25 years, the demographic groups most similar to Kiowa are Chickasaw ($44,763, a difference of 0.070%), Pueblo ($45,018, a difference of 0.64%), Black/African American ($44,381, a difference of 0.79%), Houma ($44,356, a difference of 0.85%), and Tohono O'odham ($45,248, a difference of 1.1%).
| Demographics | Rating | Rank | Householder Income Under 25 years |
| Choctaw | 0.0 /100 | #332 | Tragic $45,450 |
| Creek | 0.0 /100 | #333 | Tragic $45,371 |
| Cajuns | 0.0 /100 | #334 | Tragic $45,338 |
| Cheyenne | 0.0 /100 | #335 | Tragic $45,275 |
| Tohono O'odham | 0.0 /100 | #336 | Tragic $45,248 |
| Pueblo | 0.0 /100 | #337 | Tragic $45,018 |
| Chickasaw | 0.0 /100 | #338 | Tragic $44,763 |
| Kiowa | 0.0 /100 | #339 | Tragic $44,733 |
| Blacks/African Americans | 0.0 /100 | #340 | Tragic $44,381 |
| Houma | 0.0 /100 | #341 | Tragic $44,356 |
| Arapaho | 0.0 /100 | #342 | Tragic $44,003 |
| Immigrants | Yemen | 0.0 /100 | #343 | Tragic $43,591 |
| Immigrants | Congo | 0.0 /100 | #344 | Tragic $43,266 |
| Navajo | 0.0 /100 | #345 | Tragic $42,380 |
| Puerto Ricans | 0.0 /100 | #346 | Tragic $39,726 |
Demographics Similar to Spanish Americans by Householder Income Under 25 years
In terms of householder income under 25 years, the demographic groups most similar to Spanish Americans are Hopi ($46,978, a difference of 0.14%), Sudanese ($46,982, a difference of 0.15%), African ($46,838, a difference of 0.16%), Crow ($47,012, a difference of 0.21%), and Chippewa ($47,015, a difference of 0.22%).
| Demographics | Rating | Rank | Householder Income Under 25 years |
| Ottawa | 0.0 /100 | #311 | Tragic $47,366 |
| Bermudans | 0.0 /100 | #312 | Tragic $47,359 |
| Delaware | 0.0 /100 | #313 | Tragic $47,159 |
| Chippewa | 0.0 /100 | #314 | Tragic $47,015 |
| Crow | 0.0 /100 | #315 | Tragic $47,012 |
| Sudanese | 0.0 /100 | #316 | Tragic $46,982 |
| Hopi | 0.0 /100 | #317 | Tragic $46,978 |
| Spanish Americans | 0.0 /100 | #318 | Tragic $46,913 |
| Africans | 0.0 /100 | #319 | Tragic $46,838 |
| Immigrants | Sudan | 0.0 /100 | #320 | Tragic $46,791 |
| Potawatomi | 0.0 /100 | #321 | Tragic $46,462 |
| Sioux | 0.0 /100 | #322 | Tragic $46,417 |
| Immigrants | Saudi Arabia | 0.0 /100 | #323 | Tragic $46,187 |
| Dutch West Indians | 0.0 /100 | #324 | Tragic $45,816 |
| Immigrants | Bahamas | 0.0 /100 | #325 | Tragic $45,793 |