Korean vs Immigrants from Ghana Median Family Income
COMPARE
Korean
Immigrants from Ghana
Median Family Income
Median Family Income Comparison
Koreans
Immigrants from Ghana
$110,103
MEDIAN FAMILY INCOME
97.8/ 100
METRIC RATING
94th/ 347
METRIC RANK
$96,544
MEDIAN FAMILY INCOME
4.2/ 100
METRIC RATING
221st/ 347
METRIC RANK
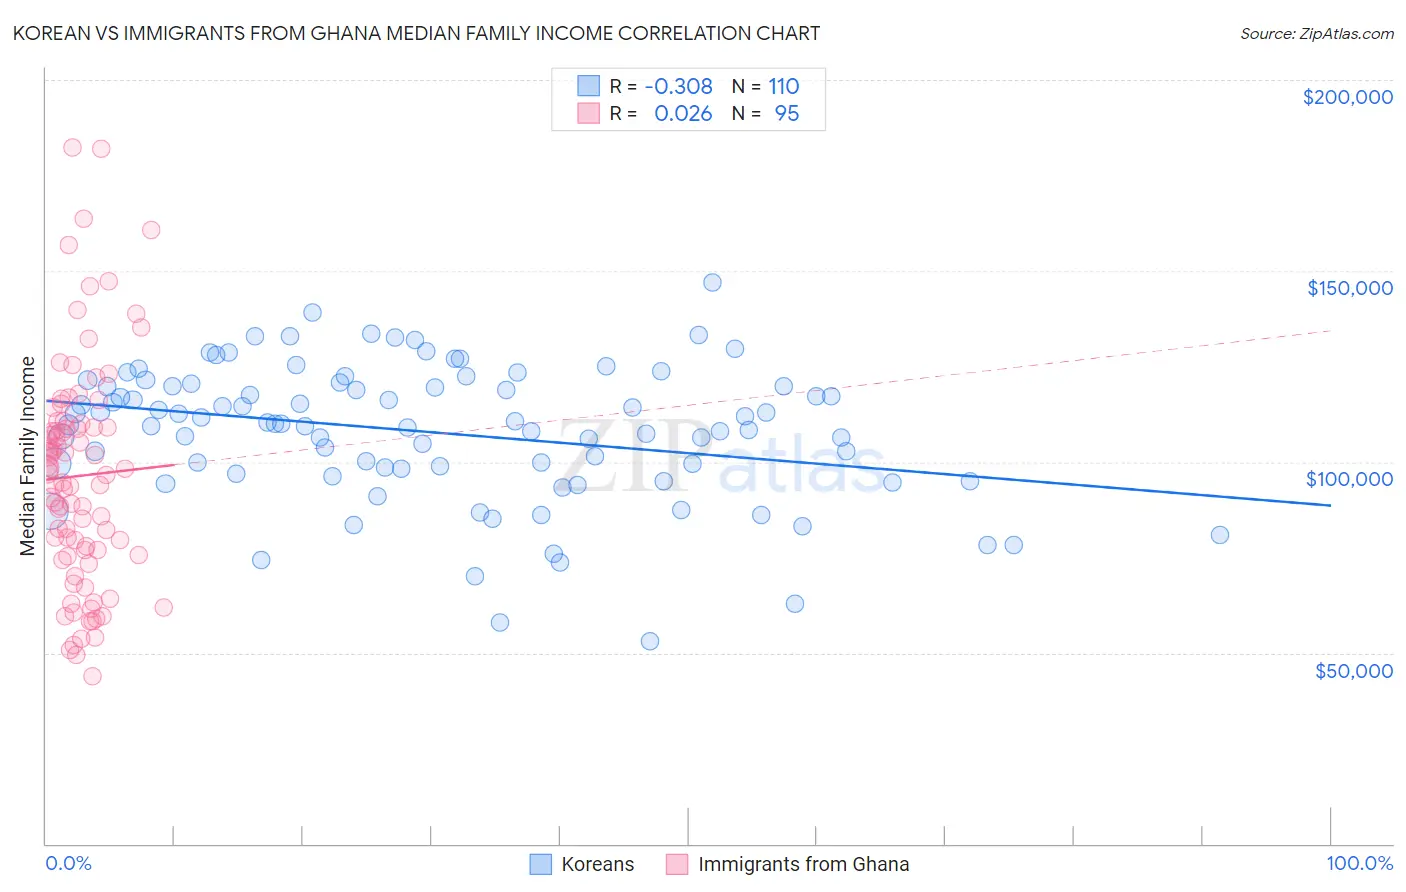
Korean vs Immigrants from Ghana Median Family Income Correlation Chart
The statistical analysis conducted on geographies consisting of 510,104,547 people shows a mild negative correlation between the proportion of Koreans and median family income in the United States with a correlation coefficient (R) of -0.308 and weighted average of $110,103. Similarly, the statistical analysis conducted on geographies consisting of 199,771,663 people shows no correlation between the proportion of Immigrants from Ghana and median family income in the United States with a correlation coefficient (R) of 0.026 and weighted average of $96,544, a difference of 14.0%.
Median Family Income Correlation Summary
| Measurement | Korean | Immigrants from Ghana |
| Minimum | $53,031 | $43,736 |
| Maximum | $146,906 | $182,203 |
| Range | $93,875 | $138,466 |
| Mean | $107,726 | $96,337 |
| Median | $109,878 | $96,719 |
| Interquartile 25% (IQ1) | $98,078 | $75,639 |
| Interquartile 75% (IQ3) | $119,779 | $110,050 |
| Interquartile Range (IQR) | $21,701 | $34,411 |
| Standard Deviation (Sample) | $17,855 | $29,276 |
| Standard Deviation (Population) | $17,774 | $29,122 |
Similar Demographics by Median Family Income
Demographics Similar to Koreans by Median Family Income
In terms of median family income, the demographic groups most similar to Koreans are Immigrants from Kazakhstan ($110,137, a difference of 0.030%), Immigrants from Lebanon ($110,159, a difference of 0.050%), Zimbabwean ($110,011, a difference of 0.080%), Immigrants from Moldova ($109,975, a difference of 0.12%), and Jordanian ($109,865, a difference of 0.22%).
| Demographics | Rating | Rank | Median Family Income |
| Austrians | 98.8 /100 | #87 | Exceptional $111,306 |
| Romanians | 98.8 /100 | #88 | Exceptional $111,243 |
| Immigrants | Argentina | 98.5 /100 | #89 | Exceptional $110,873 |
| Northern Europeans | 98.3 /100 | #90 | Exceptional $110,635 |
| Immigrants | Southern Europe | 98.3 /100 | #91 | Exceptional $110,614 |
| Immigrants | Lebanon | 97.9 /100 | #92 | Exceptional $110,159 |
| Immigrants | Kazakhstan | 97.8 /100 | #93 | Exceptional $110,137 |
| Koreans | 97.8 /100 | #94 | Exceptional $110,103 |
| Zimbabweans | 97.7 /100 | #95 | Exceptional $110,011 |
| Immigrants | Moldova | 97.7 /100 | #96 | Exceptional $109,975 |
| Jordanians | 97.5 /100 | #97 | Exceptional $109,865 |
| Immigrants | Kuwait | 97.4 /100 | #98 | Exceptional $109,731 |
| Armenians | 97.3 /100 | #99 | Exceptional $109,692 |
| Macedonians | 97.3 /100 | #100 | Exceptional $109,668 |
| Immigrants | Ukraine | 97.2 /100 | #101 | Exceptional $109,645 |
Demographics Similar to Immigrants from Ghana by Median Family Income
In terms of median family income, the demographic groups most similar to Immigrants from Ghana are Immigrants from Nigeria ($96,439, a difference of 0.11%), Sudanese ($96,783, a difference of 0.25%), Venezuelan ($96,281, a difference of 0.27%), Nonimmigrants ($96,231, a difference of 0.33%), and Delaware ($96,958, a difference of 0.43%).
| Demographics | Rating | Rank | Median Family Income |
| Bermudans | 6.9 /100 | #214 | Tragic $97,577 |
| Nigerians | 6.7 /100 | #215 | Tragic $97,522 |
| Immigrants | Bosnia and Herzegovina | 6.4 /100 | #216 | Tragic $97,432 |
| Japanese | 6.0 /100 | #217 | Tragic $97,288 |
| Immigrants | Cambodia | 5.8 /100 | #218 | Tragic $97,222 |
| Delaware | 5.1 /100 | #219 | Tragic $96,958 |
| Sudanese | 4.7 /100 | #220 | Tragic $96,783 |
| Immigrants | Ghana | 4.2 /100 | #221 | Tragic $96,544 |
| Immigrants | Nigeria | 4.0 /100 | #222 | Tragic $96,439 |
| Venezuelans | 3.7 /100 | #223 | Tragic $96,281 |
| Immigrants | Nonimmigrants | 3.6 /100 | #224 | Tragic $96,231 |
| Vietnamese | 3.4 /100 | #225 | Tragic $96,123 |
| Immigrants | Panama | 2.7 /100 | #226 | Tragic $95,647 |
| Alaska Natives | 2.6 /100 | #227 | Tragic $95,573 |
| Immigrants | Azores | 2.4 /100 | #228 | Tragic $95,402 |